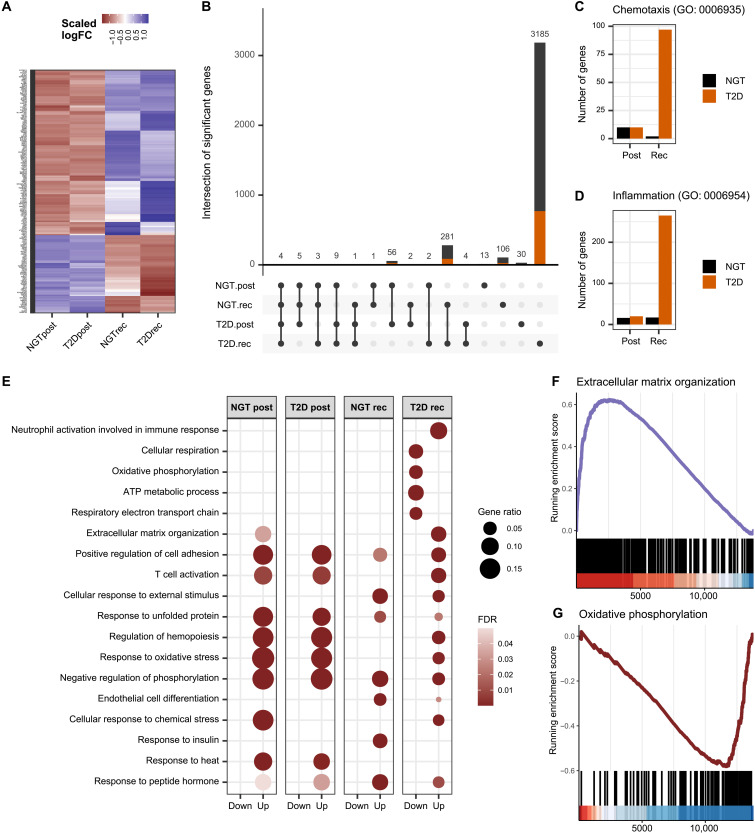
Fig. 2. Enhanced inflammatory response to exercise in skeletal muscle from men with type 2 diabetes.
(A) Heatmap of the logFC of genes significantly regulated by exercise in either normal glucose tolerance (NGT; n = 17) or type 2 diabetes (T2D; n = 20). (B) Number of genes regulated by exercise (FDR < 0.01) and their intersection. Orange, genes annotated with inflammatory processes in gene ontology. (C and D) Number of genes associated with the gene ontology pathways “chemotaxis” and “inflammatory response” increased after exercise (FDR < 0.01). (E) Exercise-responsive gene ontology biological processes calculated with an overrepresentation test. (F and G) Gene set enrichment analysis performed on genes ranked based on log(fold change) interaction effect exercise*T2D at the recovery time point.

