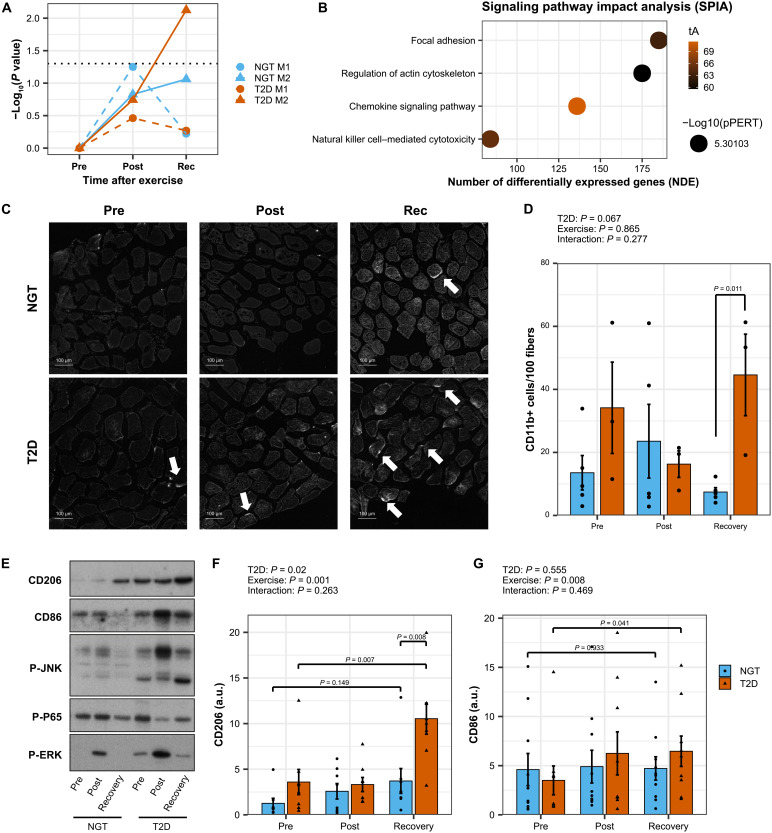
Fig. 3. Elevated exercise-induced infiltration of skeletal muscle by immune cells in individuals with type 2 diabetes.
(A) Overrepresentation analysis using Fisher’s exact test on pro- and anti-inflammatory genes signatures. (B) Signaling pathway impact analysis (SPIA). (C) Representative images of skeletal muscle labeled with CD11b. (D) Quantification of the number of immune cells per myofiber performed with ImageJ. Data are means ± SE and individual data points, n = 3 to 5. Two-way ANOVA (exercise and type 2 diabetes) and pairwise t tests. (E) Macrophage markers and inflammatory pathways analyzed by Western blotting. Representative blots. (F and G) Western blot quantifications. Data are means ± SE and individual data points, n = 8 to 10. Two-way ANOVA (exercise and type 2 diabetes) and pairwise t tests. a.u., arbitrary units.

