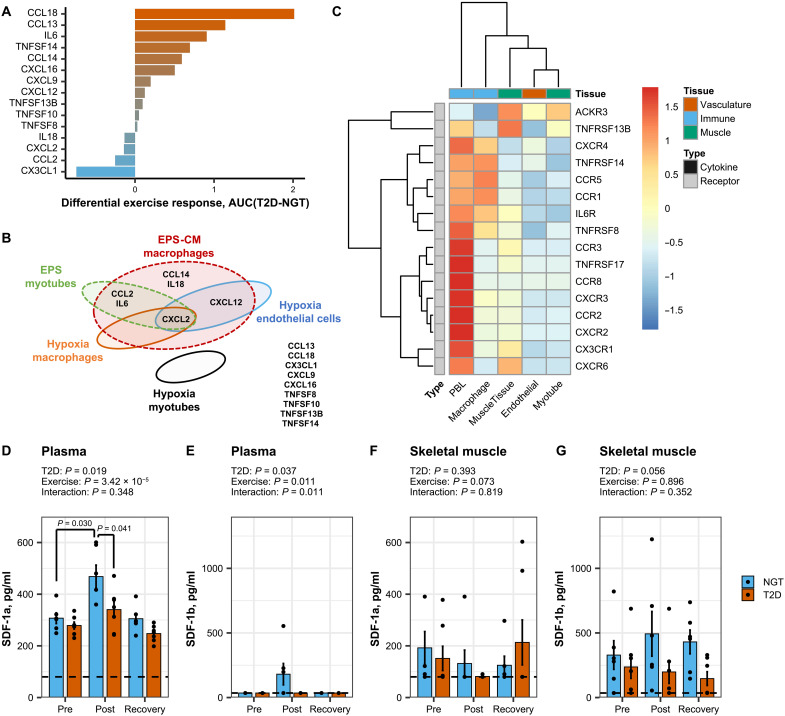
Fig. 4. Cytokine cross-talk in skeletal muscle tissue.
(A) Differential response in skeletal muscle from men with T2D versus NGT for exercise-responsive cytokines (FDR < 0.05). Area under the curve of mRNA to estimate the induction of genes compared with their relative baseline. Individual data for each cytokine in all conditions are available in fig. S2A. (B) Cytokines regulated by either EPS in primary human myotubes (green), hypoxia in macrophages (orange), or hypoxia in endothelial cells (blue). Cytokines induced in human THP1 macrophages in response to conditioned media from electrical pulse–stimulated myotubes (red). No cytokines were induced in human primary myotubes exposed to hypoxia (black). Several cytokines were not induced under any condition (side list). Individual data for each cytokine in all conditions are available in figs. S2 and S3. (C) Publicly available RNA sequencing data from bulk skeletal muscle tissue and peripheral blood leukocyte (PBL), as well as primary myotube and monocyte-derived macrophages differentiated in vitro. (D to G) CXCL12/SDF-1 measurement in plasma and skeletal muscle tissue lysate of men with T2D (n = 6) versus healthy individuals (n = 7). Alpha and beta isoforms of CXCL12 were quantified using enzyme-linked immunosorbent assay (ELISA). Dotted lines represent the detection threshold of the assays. Data are mean ± SE and individual datapoints, n = 6 to 7, two-way ANOVA (exercise and T2D) and pairwise t tests.

