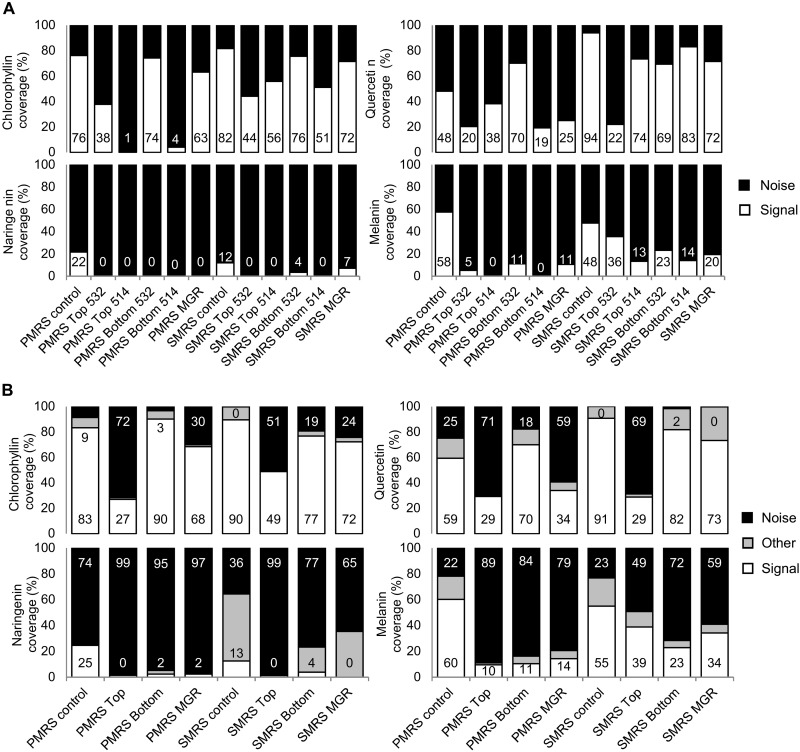
Fig. 4. Coverage of signal, quantitative analysis.
(A) Results of filter/manual counting for the four biomolecules with the most signal (chlorophyllin, naringenin, quercetin, and melanin) analyzed with a 532-nm excitation wavelength (DLR Berlin) and with a 514-nm excitation wavelength (OU Milton Keynes) for the Top (UV exposed), Bottom (UV shielded), MGR, and control samples. Positive signal is shown in white, and actual coverage percentage is indicated at the bottom of the bar. (B) Results of HCA for the four biomolecules with the most signal (chlorophyllin, naringenin, quercetin, and melanin) divided into three classes: signal (white, with percentage indicated at the bottom of the bar), other (gray), and noise (black, with percentage indicated at the top of the bar). Labels of the bar charts are indicated below the second rows.

