FIGURE 3.
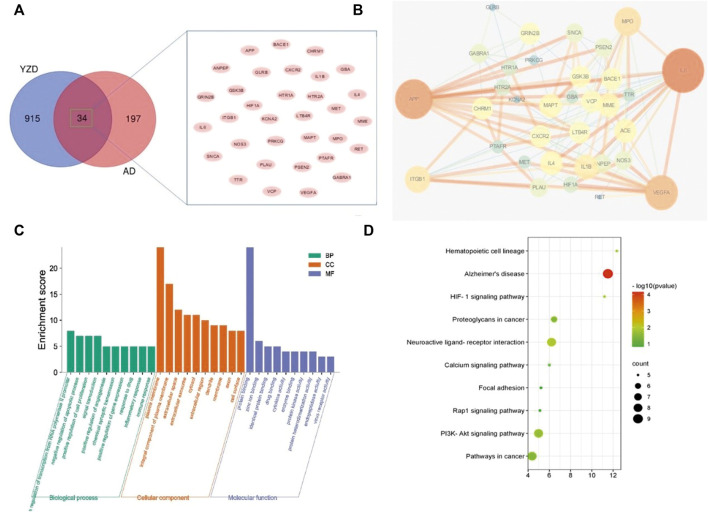
Analysis of proteins potentially affected by YZD treatment. (A) Venn diagram illustrating the overlap between proteins interacting with components of YZD and proteins know or predicted to be involved in the pathogenesis of AD. (B) PPI network of AD-related proteins that can interact with YZD components. (C) Analysis of the GO classification of the same set of proteins. (D) KEGG enrichment results of the interacting proteins represented as a bubble map. Red indicates greater, green a lesser enrichment of a given KEGG pathway, while the size of the bubbles corresponds to the number of proteins in each group.

