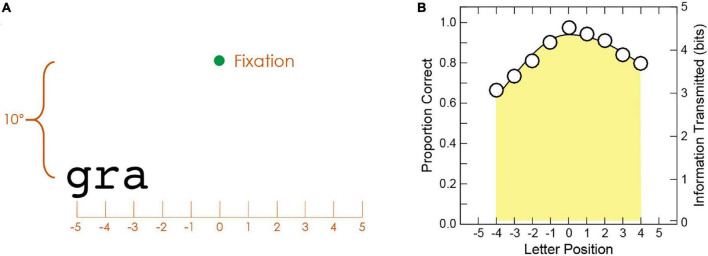
FIGURE 2.
(A) Illustration of a trigram trial. Only the fixation point and the trigram were shown on the testing screen. The trigram “gra” is centered at position –4. In this case, three letter responses are collected, one for each of the three letter positions (–5, –4, and –3). (B) Sample visual-span profile. The area under the visual-span profile provides the total amount of information transmitted in bits.

