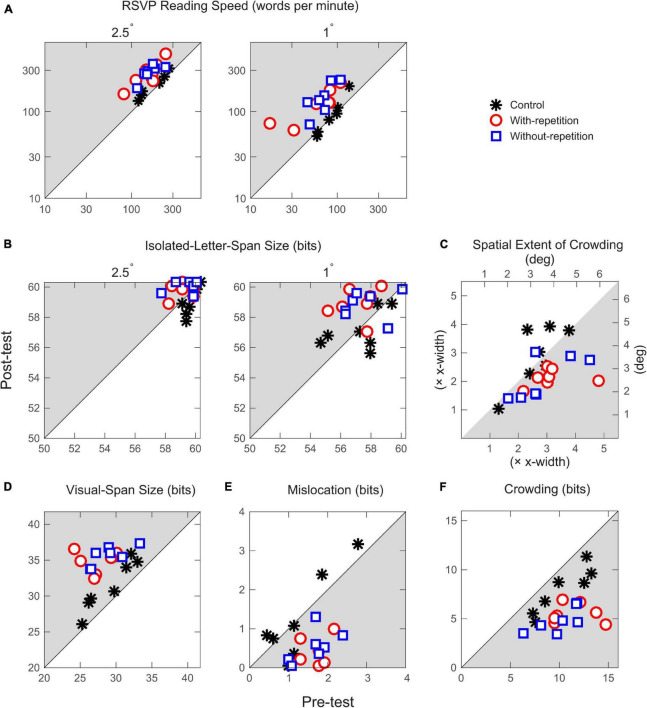
FIGURE 3.
Scatter plots of post-test performance vs. pre-test performance for the three observer groups. (A) Rapid Serial Visual Presentation (RSVP) reading speeds at 2.5° and 1° print sizes. Each data point represents one observer. Points on the diagonal line imply no change between the pre- and post-tests. Data points lying inside the shaded region indicate improved performance in the post-test. (B) The size of the isolated-letter span at 2.5° and 1° print sizes. The maximum possible amount of information transmitted through 13 letter positions is 60.31 bits. (C) Spatial extent of crowding. The top horizontal scale and the right vertical scale show conversion from multiples of x-width to degrees. (D) The size of the visual span. The maximum possible amount of information transmitted through nine letter positions is 41.75 bits. (E) Mislocation-induced information loss. (F). Crowding-induced information loss.

