
FIGURE 8.
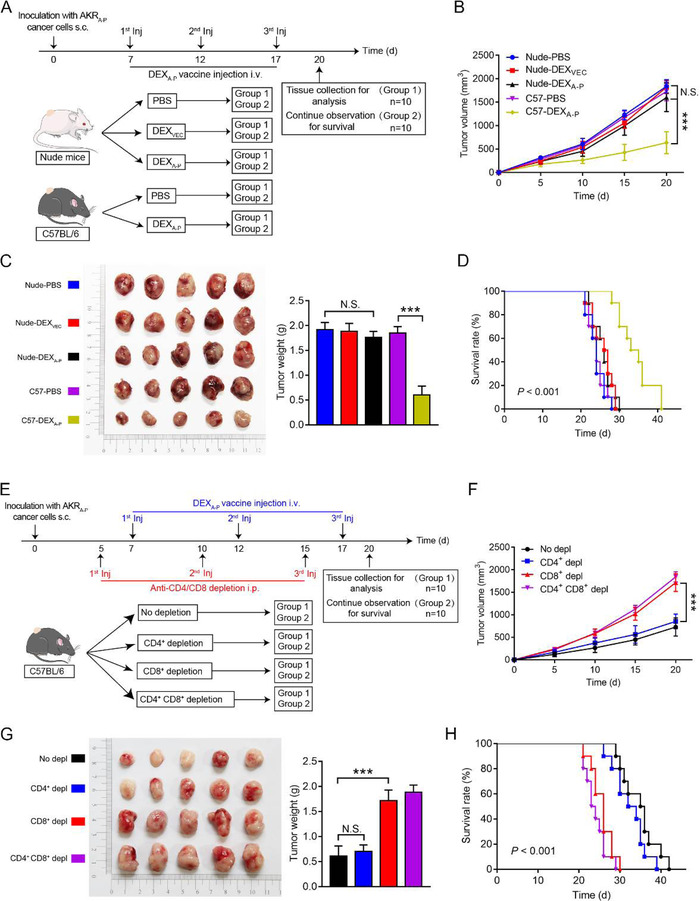
In vivo assessment of antitumour activity of DEXA‐P vaccination. (A) On day 0, nude athymic mice (strain NU/NU) or immunocompetent C57BL/6 mice (n = 10 animals per group) were s.c. inoculated with AKRA‐P cancer cells and then vaccinated with 3 consecutive injections (day 7, 12, and 17) with DEXA‐P, DEXVEC or PBS, respectively. (B) Tumour growth curves in tumour‐bearing nude mice vaccinated with DEXA‐P, DEXVEC or PBS, respectively and C57BL/6 mice vaccinated with DEXA‐P or PBS, respectively. (C) Representative images (left panel) and average weights (right panel) of tumours harvested on 20 d after AKRA‐P cancer cell inoculation. (D) Kaplan‐Meier survival curves of tumour‐bearing nude mice vaccinated with DEXA‐P, DEXVEC or PBS, respectively and C57BL/6 mice vaccinated with DEXA‐P or PBS, respectively. (E) At day 0, C57BL/6 mice (n = 10 animals per group) were s.c. inoculated with AKRA‐P cells and then injected at day 5, 10, and 15 with a CD8‐depleting and/or CD4‐depleting Abs vaccinated with 3 consecutive injections at day 7, 12, and 17 of DEXA‐P (F) Tumour growth curves of DEXA‐P‐ vaccinated tumour‐bearing mice after CD8+‐ and/or CD4+ T cells depletion (Depl). (G) Representative images (left panel) and average weights (right panel) of tumours harvested on 20 d after AKRA‐P cancer cell inoculation. (H) Kaplan‐Meier survival curves of DEXA‐P vaccinated tumour‐bearing mice after CD8+‐ and/or CD4+ T cells Depl. Error bars indicate SEM. N.S. not significant, ***p < 0.001 by one‐way ANOVA with post hoc intergroup comparisons in (B‐C, E‐F). Log‐rank test was used in (D and H)