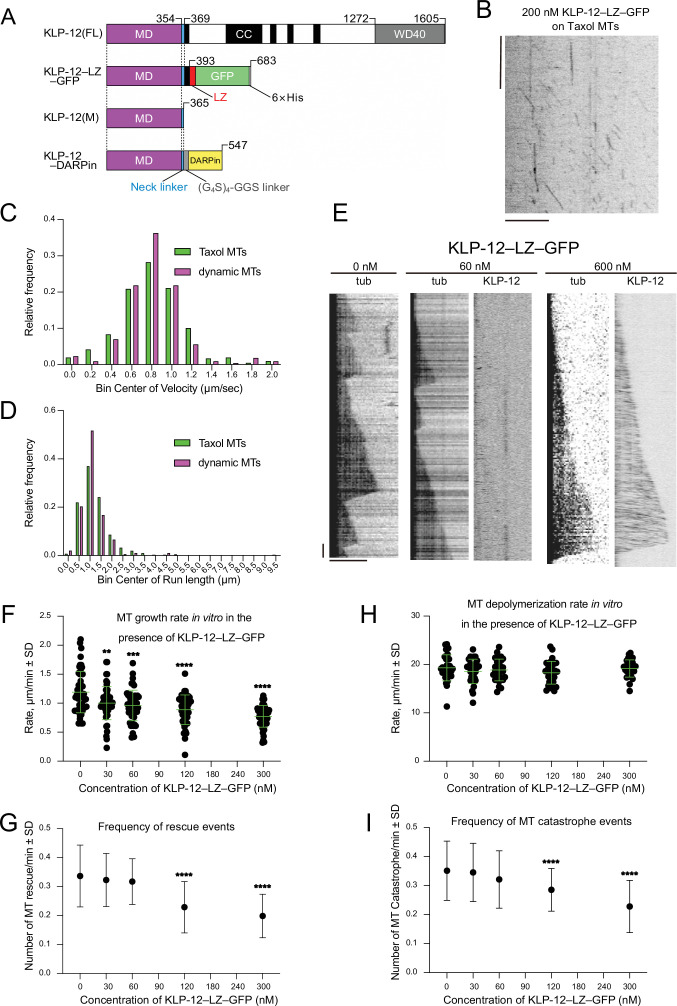
Figure 2. KLP-12 is a plus-end directed motor that represses microtubule polymerization.
(A) Schematic presentation of the KLP-12 constructs. KLP-12(FL): full-length KLP-12, KLP-12–LZ–GFP: KLP-12 (1-393) with GFP connected with a leucine zipper, KLP-12(M): KLP-12 motor domain (1-365), KLP-12–DARPin: KLP-12(M) with DARPin connected with a flexible linker. (B) A representative kymograph showing the motility of KLP-12–LZ–GFP on taxol-stabilized microtubules. Horizontal and vertical bars show 10 μm and 10 s, respectively. (C) Histogram showing the velocity of KLP-12–LZ–GFP on taxol-stabilized (green) or dynamic (magenta) microtubules. 0.81±0.32 µm/s (n=407) and 0.82±0.31 µm/s (n=215) on taxol-stabilized and dynamic microtubules, respectively. Mean ± standard deviation. No statistically significant differences were detected by Student’s t-test. (D) Histogram showing the run length of KLP-12–LZ–GFP on taxol-stabilized (green) or dynamic (magenta) microtubules. n=407 molecules. 1.30±0.89 µm (n=407) and 1.11±0.57 µm (n=215) on taxol-stabilized and dynamic microtubules, respectively. Mean ± standard deviation. No statistically significant differences were detected by Student’s t-test. (E) Representative kymographs showing the microtubule dynamics and the motility of KLP-12–LZ–GFP. 10 μM of fluorescently labeled microtubules were polymerized from GMPCPP stabilized microtubule seeds fixed on the cover glass in the presence of 0, 60, or 600 nM KLP-12–LZ–GFP at 30 °C. Horizontal and vertical bars show 5 μm and 60 s, respectively. (F–I) The effect of KLP-12–LZ–GFP on microtubule dynamics. 10 μM of fluorescently labeled microtubules were observed in the presence of indicated concentrations of KLP-12–LZ–GFP at 30 °C. (F) Microtubule growth rate in vitro in the presence of KLP-12–LZ–GFP. Green bars show mean ± standard deviation. **, Adjusted p=0.0022, ***, Adjusted p=0.0001, ****, Adjusted p<0.0001, compared with control (0 nM). One-way ANOVA followed by Dunnett’s multiple comparisons test. n=52 microtubules. (G) Frequency of microtubule catastrophe events. The number of microtubule catastrophe in vitro was normalized by minute. mean ± standard deviation. ****, Adjusted p<0.0001, compared with control (0 nM). One-way ANOVA followed by Dunnett’s multiple comparisons test. n=101 microtubules. (H) Microtubule depolymerization rate in vitro in the presence of KLP-12–LZ–GFP. Green bars show mean ± standard deviation. No statistically significant differences were detected by One-Way ANOVA. n=30 microtubules. (I) Frequency of microtubule rescue events. The number of microtubule rescue events in vitro was normalized by minute. ****, Adjusted p<0.0001, compared with control (0 nM). One-way ANOVA followed by Dunnett’s multiple comparisons test. n=99 microtubules. The effect of microtubule growth rate by kinesin-4 family motors is available in Figure 2—figure supplement 1.


