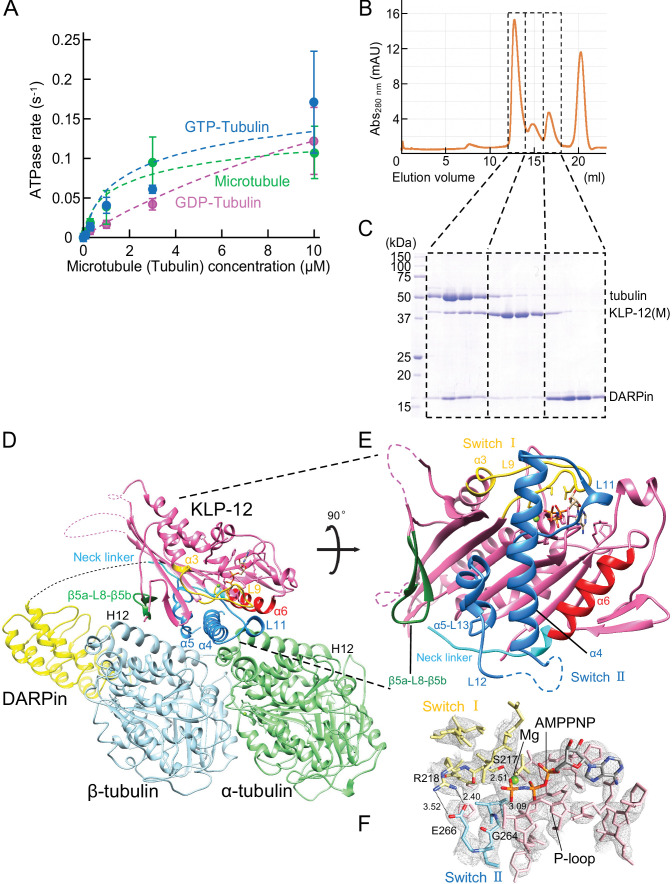
Figure 3. Crystal structure of KLP-12-tubulin complex.
(A) The steady-state ATPase activity of KLP-12(M) measured with GDP tubulin heterodimers, GTP tubulin heterodimers, and microtubules at 30 °C. Error bars represent standard deviation. Tubulin or microtubule GTPase effect was canceled by subtracting control without KLP-12(M). (B) Size exclusion chromatography (SEC) of tubulin mixed with KLP-12(M) and DARPin. (C) SDS–PAGE analysis of the SEC peaks of tubulin mixed with KLP-12(M) and DARPin. SDS-PAGE analysis of the SEC peaks of tubulin combined with KLP-12–DARPin is available in Figure 3—figure supplement 2. (D) Crystal structure of the tubulin–KLP-12–DARPin complex. Disordered linkers were drawn as a dotted line. α-tubulin is colored in light green, β-tubulin is in light blue, DARPin is in yellow, and KLP-12 is in magenta. See also Video 1 for details. (E) KLP-12 structure viewed from the interface with tubulin. The residues of the important structure are shown in color. β5a-L8-β5b is green, switch I is yellow, switch II is blue, α6 is red, and the neck linker is cyan. (F) Nucleotide binding pocket of KLP-12. The 2Fo-Fc map around AMP-PNP was calculated with coefficient 2Fo− Fc and contoured at 2.0 σ.
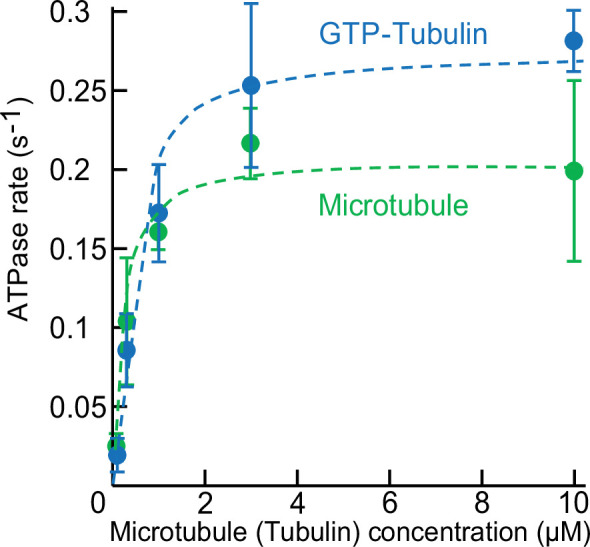
Figure 3—figure supplement 1. ATPase activity of KLP-12–LZ–GFP with microtubule or GTP-Tubulin.

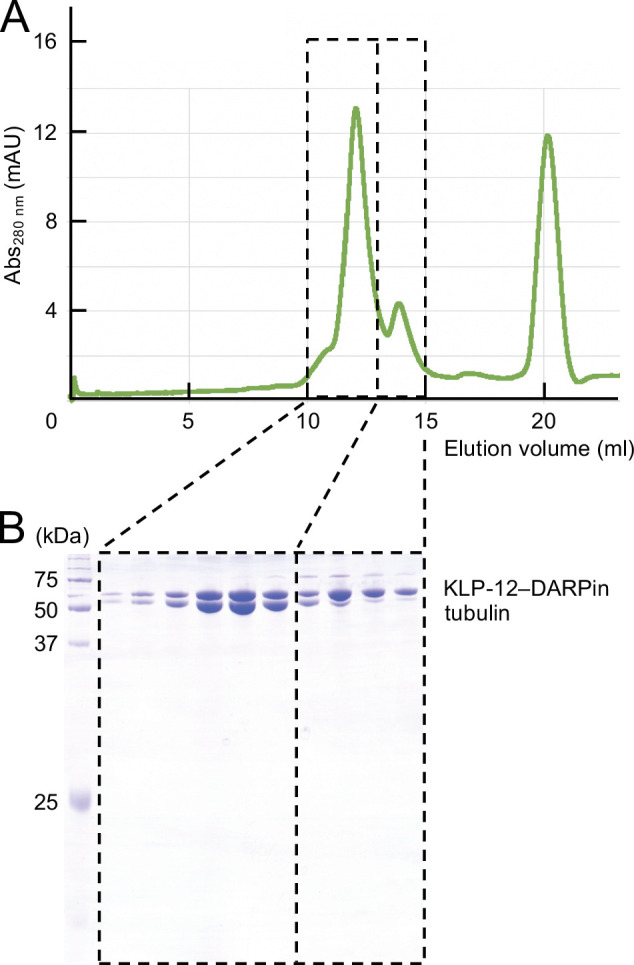
Figure 3—figure supplement 2. The complex formation of KLP-12–DARPin and tubulin dimers.


