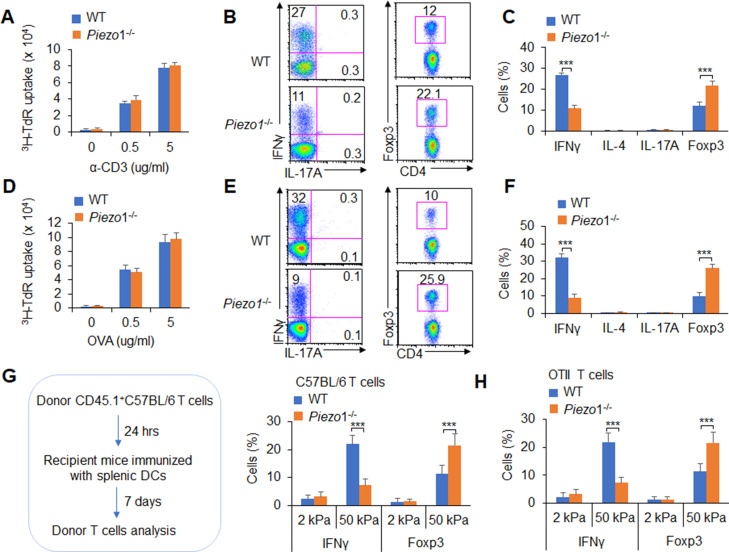
Figure 2. Dendritic cell (DC)-specific Piezo1 expression directs the differentiation of TH1 and Treg cells in vivo.
(A–C) Naïve CD45.2+ T cells were transferred into CD45.1+ C57BL/6 WT mice, and the mice were immunized with WT and Piezo1-/- splenic DCs and lipopolysaccharide (LPS). DLN cells were analyzed at day 7 after immunization. (A) Donor CD45.2+ T cell proliferation after stimulation with anti-CD3 (2 µg/ml) and anti-CD28 (2 μg/ml) antibodies. (B–C) Intracellular staining of IFNγ, IL-4, IL-17A, and Foxp3 expression in donor-derived (CD45.2+) CD4+ T cells after PMA and ionomycin stimulation. A representative figure shown in B, and the data summarized in C. (D–F) Naïve OTII T cells were transferred into CD45.1+ C57BL/6 WT mice, and the mice were immunized with WT and Piezo1-/- splenic DCs and OVA+CFA. DLN cells were analyzed at day 7 after immunization. (D) Donor CD45.2+ T cell proliferation after stimulation with OVA. (E–F) Intracellular staining of IFNγ, IL-4, IL-17A, and Foxp3 in donor-derived (CD45.2+) CD4+ T cells after OVA stimulation. A representative figure shown in E, and the data summarized in F. (G–H) Splenic DCs isolated from WT and Piezo1-/- mice were plated on 2 and 50 kPa hydrogels and incubated for 24 hr. (G) Naïve T cells were transferred into CD45.1+ C57BL/6 WT mice, and the mice were immunized with 2 and 50 kPa hydrogel-conditioned DCs. DLN cells were analyzed at day 7 after immunization. Intracellular staining of IFNγ, IL-4, and IL-17A in donor-derived (CD45.2+) CD4+ T cells after PMA and ionomycin stimulationand data summarized. (H) Naïve OTII T cells were transferred into CD45.1+ C57BL/6 WT mice, and the mice were immunized with 2 or 50 kPa hydrogel-conditioned DCs and OVA+CFA. DLN cells were analyzed at day 7 after immunization. Intracellular staining of IFNγ, IL-4, and IL-17A in donor-derived (CD45.2+) CD4+ T cells after OVA stimulation and data summarized. The data are representative of three to four independent experiments (mean ± s.d.; n=3–4). ***p<0.001, compared with the indicated groups.

