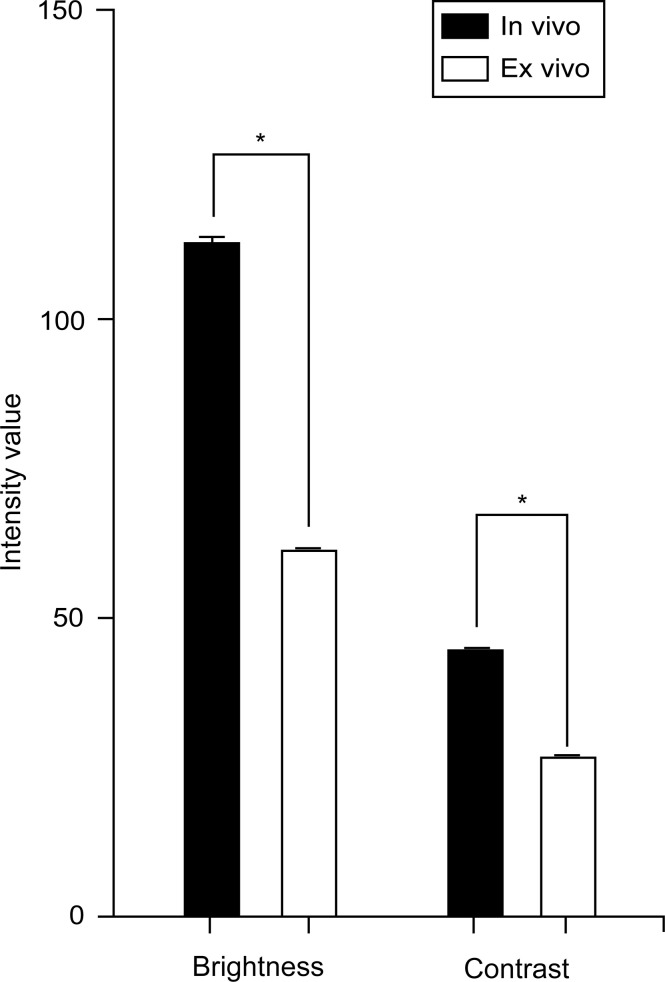
Figure 1.
Bar chart showing a comparison of overall mean (SD) brightness and contrast of in vivo and ex vivo images. In vivo images had a mean brightness of 112.1 (26.9) and contrast of 44.7 (8.0). Ex vivo images had a mean brightness of 60.7 (23.6) and a contrast of 26.8 (7.9). In vivo images have higher brightness and contrast than ex vivo images (p < 0.001). Values are reported in optical density units defined by the Fiji software. Asterisk indicates p < 0.001. Used with permission from Barrow Neurological Institute, Phoenix, Arizona.

