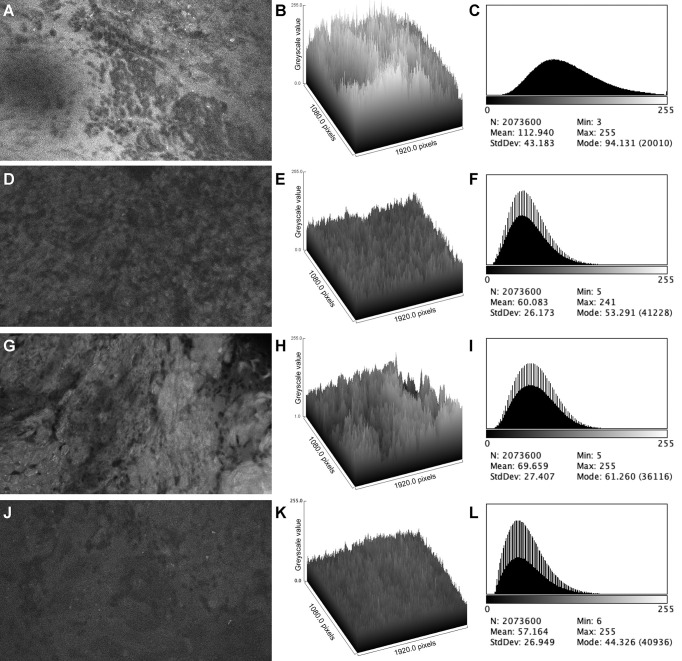
Figure 2.
Examples of confocal laser endomicroscopy images and data from in vivo and ex vivo studies. In vivo image and data (A–C) show a brighter background and more perceivable cellular structure than the corresponding ex vivo image and data (D–F). Ex vivo image and data from a patient who had an additional FNa dose (G–I) shows improved overall brightness and contrast compared to the image from the same patient before FNa redosing (J–L). Mean, brightness; StdDev, brightness; Min and Max, minimum and maximum gray value of pixels in the image; Mode, most frequent occurring gray value in the image. Values are reported in optical density units defined by Fiji software. Used with permission from Barrow Neurological Institute, Phoenix, Arizona.

