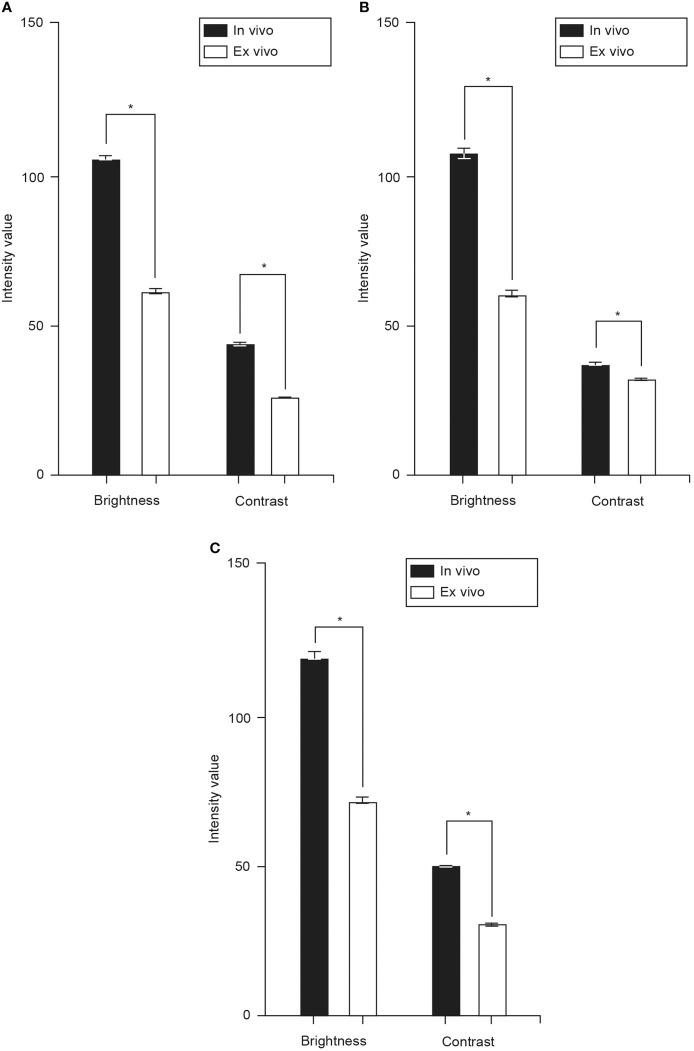
Figure 6.
Bar charts showing mean brightness and contrast of images from glioma (A), meningioma (B), and intracranial metastatic tumor (C) cases from both studies. The mean brightness and contrast of the in vivo images from glioma (brightness: 105.2 [25.8] vs. 60.6 [8.1], p < 0.001; contrast: 43.2 [24.9] vs. 26.5 [6.9], p < 0.001), meningioma (brightness: 106.3 [26.0] vs. 60.0 [18.8], p < 0.001; contrast: 36.7 [8.0] vs. 31.7 [8.9], p < 0.001), and intracranial metastatic tumor (brightness: 118.2 [26.5] vs. 70.6 [25.1], p < 0.001; contrast: 49.6 [4.9] vs. 30.1 [6.8], p < 0.001, Figure 6C values are significantly higher than those of the ex vivo images. Values are reported in optical density units defined by Fiji software. Asterisk indicates p < 0.001. Used with permission from Barrow Neurological Institute, Phoenix, Arizona.

