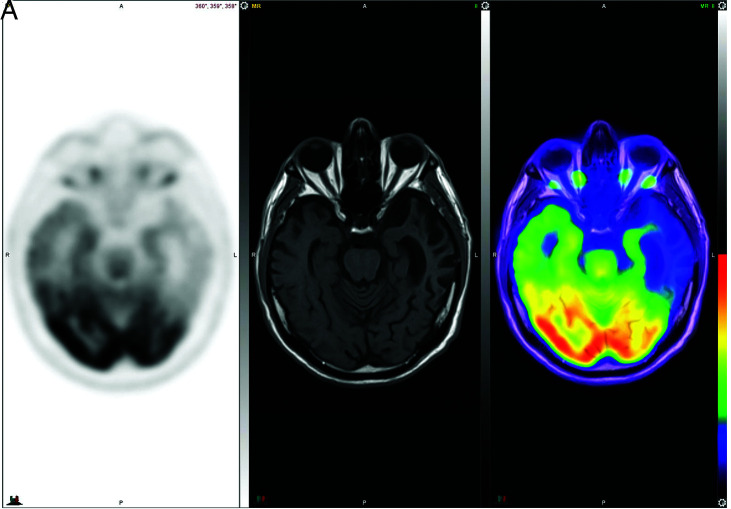
FIG 8.
[18F] FDG-PET (A), axial T1 (B), and PET MR imaging (C) views demonstrate an abnormal FDG distribution pattern with markedly decreased tracer uptake in the temporal lobes, particularly in the left temporal pole. There is corresponding advanced cortical atrophy with a “knife-blade” appearance in the left anterior temporal lobe on the axial T1 sequence.

