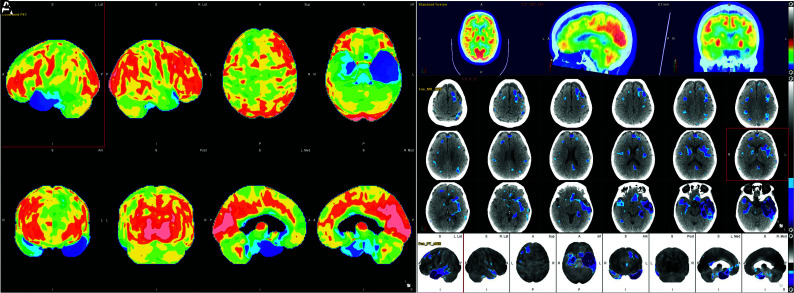
FIG 9.
[18F] FDG-PET cortical surface maps demonstrate an abnormal FDG distribution pattern with severe left and moderate right hypometabolism in the anterior temporal lobes (A), with corresponding disproportionate cortical atrophy, particularly pronounced in the left temporal pole visualized on brain CT images (B), findings further supported by semiquantitative FDG-PET analysis using z scores calculated in comparison with findings in age-matched cognitively healthy controls, semiquantitative FDG-PET analysis demonstrate markedly decreased values in the temporal lobes including the temporal poles (left > right) (B).

