FIG 2.

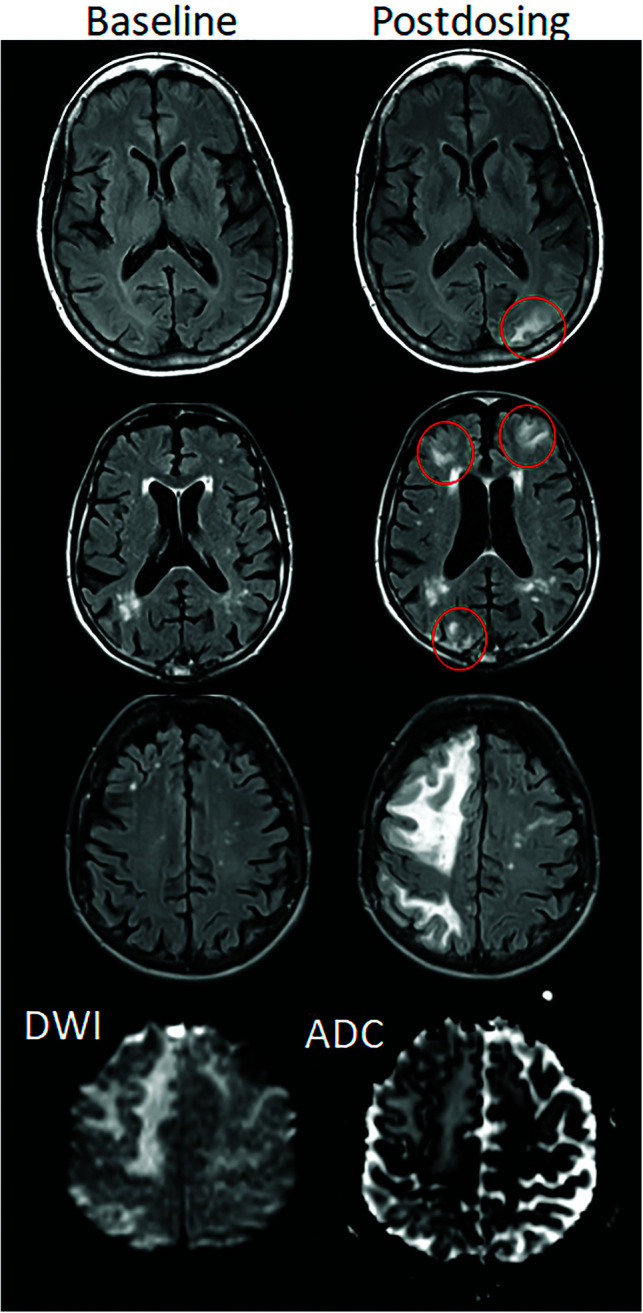
ARIA-E, parenchymal edema. Axial T2-FLAIR images from 3 separate patients at the time of the pretreatment baseline (left) and on a monitoring examination following initiation of anti-amyloid monoclonal antibody therapy (postdosing, right). A, On the postdosing examination, new T2-FLAIR hyperintense signal in the left parieto-occipital subcortical white matter with mild local mass effect and sulcal effacement measuring <5 cm the transverse dimension (mild ARIA-E, red circle). B, New multifocal, patchy T2-FLAIR hyperintense signal in the bifrontal and right occipital subcortical white matter on the postdosing examination, each region measuring <5 cm (red circles). A single region measuring <5 cm would be classified as mild, but >1 yields a classification of moderate ARIA-E. Multiplicity of ARIA-E involvement yields a classification of moderate, as long as each region is <10 cm in diameter. In some regions, there is involvement of the cortex, mild local mass effect, and gyral swelling. C, On the postdosing examination, development of extensive T2-FLAIR hyperintense signal throughout the right frontal and parietal lobes measuring >10 cm (severe ARIA-E). Associated mass effect and sulcal effacement throughout much of the right cerebral hemisphere. Hyperintense signal on DWI (lower left) is confirmed to be T2 shinethrough on the ADC map (lower right), differentiating ARIA-E from acute ischemia or other cause of cytotoxic edema. Images courtesy of Biogen and the Dominantly Inherited Alzheimer Network.
