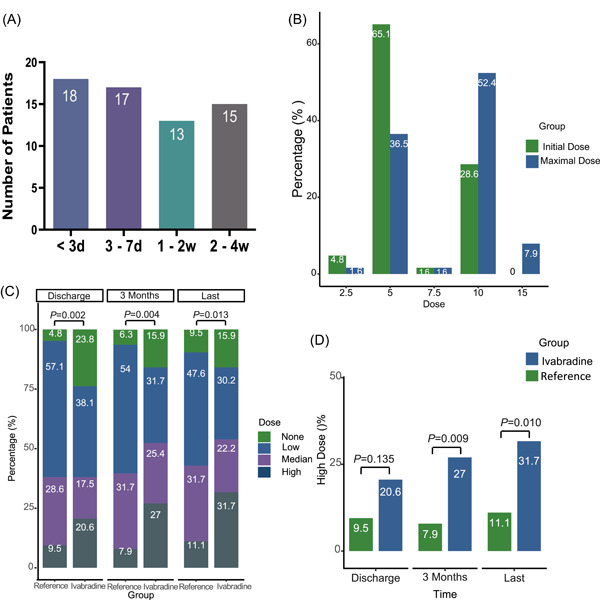
Figure 1.

Descriptions of ivabradine and β‐blockers during the follow‐up. χ 2 and Fisher's exact test. (A) Durations from admission to adding ivabradine. (B) Initiated dose and maximal dose of ivabradine at the 3‐month follow‐up. (C) The percentage comparisons of different doses of β‐blockers between groups. (D) Percentage comparisons of HF patients with a high dose of β‐blockers at discharge, 3‐month, and last follow‐up. HF, heart failure.
