FIG. 1.
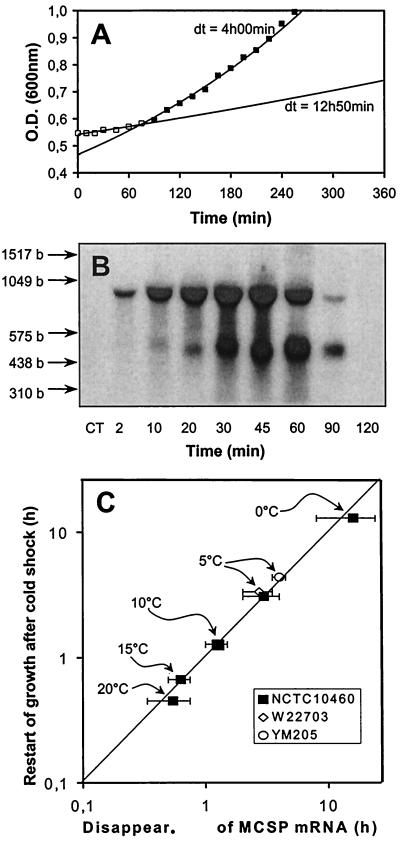
(A) Example of a growth curve from Y. enterocolitica NCTC 10460 after a cold shock from 30 to 10°C. The lag period after cold shock is indicated by open squares. Filled squares indicate restart of exponential growth. dt, doubling times. O.D., optical density. (B) Example of a Northern blot after cold shock from 30 to 10°C (corresponding to panel A). The blot was performed using a probe against cspA1 and shows a lower monocistronic and an upper bicistronic signal of the cspA1/A2 tandem. The CT was obtained from a sample without cold shock. The locations of markers are shown by arrows, and their lengths are given in bases (b). (C) Correlation of the time points when cold-shocked cultures of Y. enterocolitica restart exponential growth (y axis, calculated from growth data) and the time points when the cspA1/A2 mRNA disappears (x axis, derived from Northern blot data). The temperature of the cold shock is indicated. The error bars include the time points before and after degradation is clearly visible in the Northern blots. The indicated theoretical line would be obtained if there were a 100% correlation of both parameters. The data for the parent strain W 22703 and the PNPase-deficient strain YM 205 from Fig. 2 are included (open symbols).

