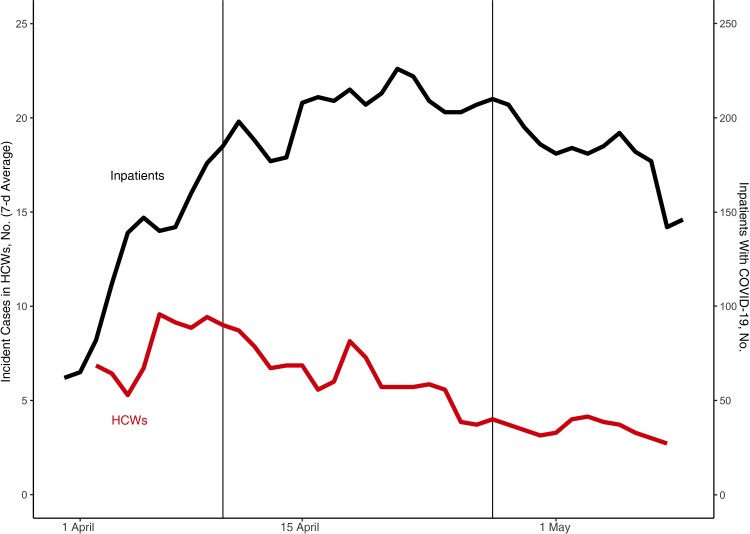
Figure 1.
Severe acute respiratory syndrome coronavirus 2 case surveillance at Boston Medical Center and the implementation of infection control measures. The rolling 7-day time-average of incident coronavirus disease 2019 (COVID-19) cases among healthcare workers (HCWs) (lower red line) is shown, along with the daily inpatient COVID-19 census (upper black line). Data were left truncated to the first date of mandatory masking (27 March). First vertical line (10 April) indicates the addition of enhanced personal protective equipment; second vertical line (27 April), the addition of universal testing for inpatients and symptomatic HCWs. Plotting begins later than our earliest data point owing to the exclusion of backlogged reporting and the use of a centered 7-day average.

