Figure 4.
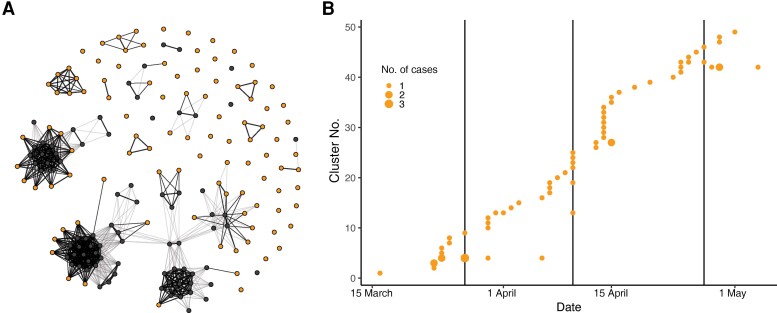
Transmission clusters with sequences unique to Boston Medical Center (BMC). A, Network representation of all sequences (nodes) with edges representing potential transmission. Starting with the earliest sequence as a cluster, subsequent sequences join into a cluster if they are within 1 single-nucleotide polymorphism (SNP) of a cluster member, occur within 14 days of a cluster member, and, for 1-SNP connections, are not isogenic to any sequences observed in GISAID. Dark edges show surviving connections; lighter edges, connections between genomically similar sequences that do not satisfy the other conditions. Thicker and thinner edges reflect 0-SNP and 1-SNP differences between sequences, respectively. Healthcare worker sequences unique to BMC are shown in orange; those isogenic to sequences in GISAID, in black. B, Incidence of transmission clusters over time.

