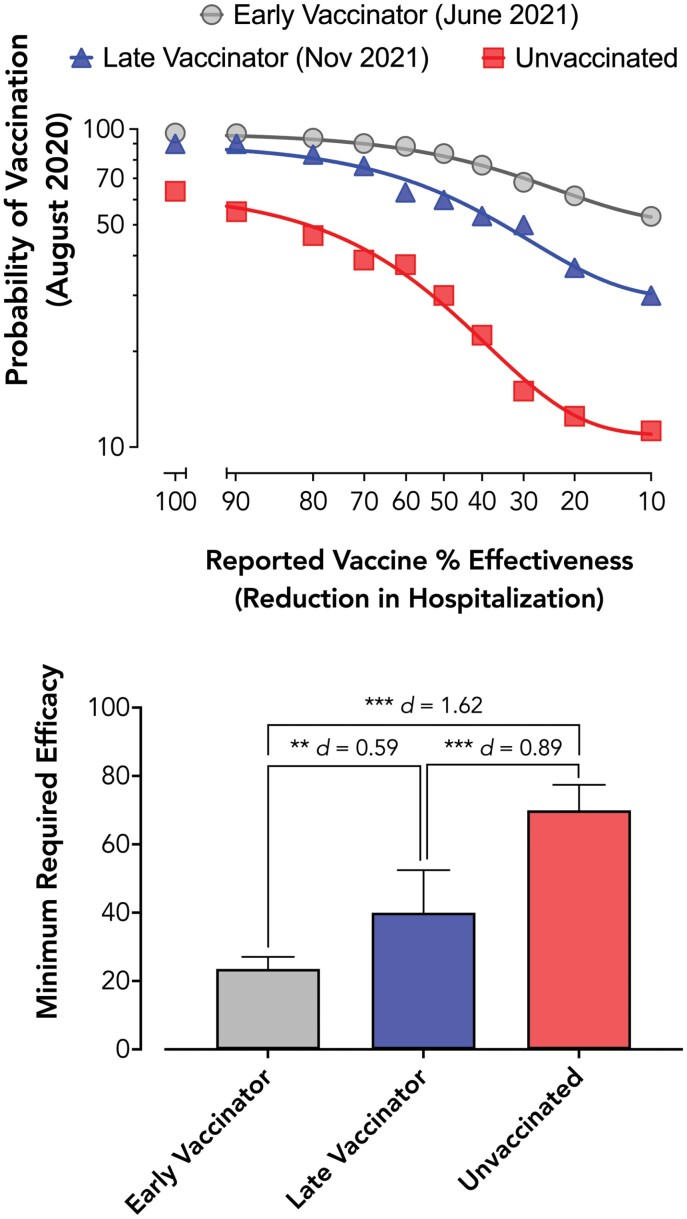
Fig. 1.
COVID-19 vaccine demand by future vaccination status. Plotted are vaccine demand task by future vaccination status (early vaccinator, n = 222, gray circle; late vaccinator, n = 31, blue triangle; unvaccinated, n = 80, red square). The bottom panel presents minimum required efficacy from individual subject responses (mean with 95% confidence intervals). Significance (** p < .01; *** p < .001) and Cohen’s d effect sizes are also presented.

