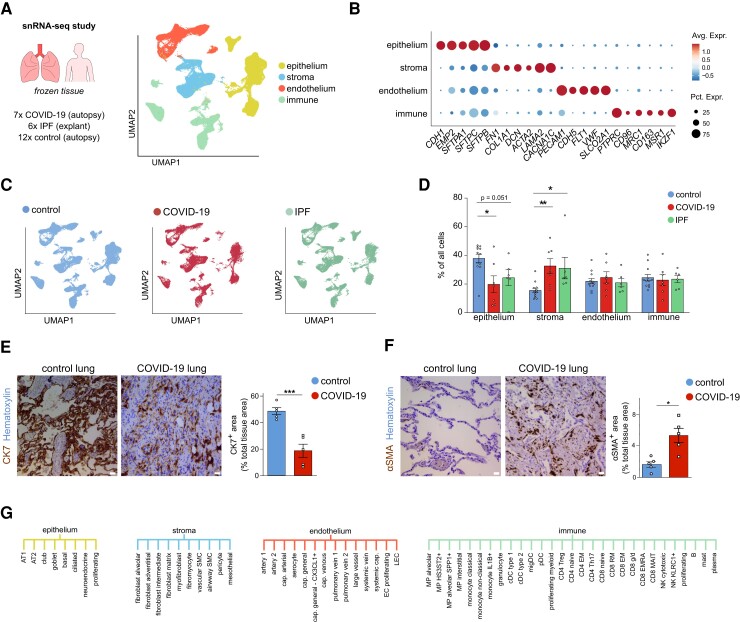
Figure 1.
Pulmonary cell types in COVID-19, IPF, and control lungs. A, UMAP plot of lung cells from 7 deceased COVID-19 patients, 6 IPF patients who required lung transplantation, and 12 SARS-CoV-2-uninfected controls (who died of causes unrelated to lung disease), colour-coded by major cellular lineage. B, Dot plot heatmap of expression of representative marker genes of major cellular lineages. The size and colour intensity of each dot represent, respectively, the percentage of cells within each cell type expressing the marker gene and the average level of expression of the marker in this cell type. Colour scale: top (red), high expression; bottom (blue), low expression. C, UMAP plot of lung cells, colour-coded for the indicated conditions. D, Fractions of major cell types in COVID-19, IPF, and control samples. Mean ± SEM, Kruskal–Wallis, and Dunn’s test for multiple comparisons, *P < 0.05, **P < 0.01. n = 7, 6, and 12 for COVID-19, IPF, and control, respectively. E, Representative images of lung sections from COVID-19 and control subjects, immunostained for the epithelial marker cytokeratin-7 (CK7; brown (dark staining)). Quantifications of the CK7-positive area (% of the total tissue area) are provided to the right of the images. Scale bar: 25 μm. Mean ± SEM, unpaired t-test, two-tailed, ***P < 0.001, n = 5 and n = 5 for COVID-19 and control, respectively. F, Representative images of lung sections from COVID-19 and control subjects, immunostained for the stromal marker alpha-smooth muscle actin (αSMA; brown (dark staining)). Scale bar: 25 μm. Quantifications of the αSMA-positive area (% of the total tissue area) are provided to the right of the images. Data are mean ± SEM, unpaired t-test with Welch correction, two-tailed, *P < 0.05, n = 5 and n = 5 for COVID-19 and control, respectively. G, Overview of the 61 different subclusters identified in epithelial, stromal, endothelial, and immune lineages (for a description of all subclusters and their marker genes, see Supplementary material online, Supplementary Methods).

