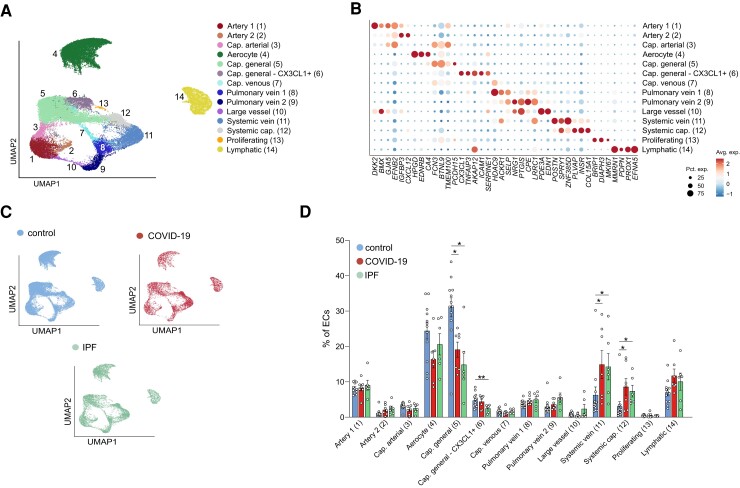
Figure 2.
Vascular subclusters in COVID-19, IPF, and control lungs. A, UMAP plot of EC transcriptomes, colour- and number-coded for the 14 subtypes identified by graph-based clustering. B, Dot plot heatmap of the expression of EC subtype-specific marker genes used for subcluster annotation. The size and colour intensity of each dot represent, respectively, the percentage of cells within each cell type expressing the marker gene and the average level of expression of the marker in this cell type. Colour scale: top (red), high expression; bottom (blue), low expression. C, UMAP plots of ECs, colour-coded per condition D, Fraction of EC subtypes in COVID-19, IPF, and control samples. Data are mean ± SEM, Kruskal–Wallis, and Dunn’s test for multiple comparisons, n = 7 (COVID-19), 6 (IPF), 12 (controls), *P < 0.05, **P < 0.01.

