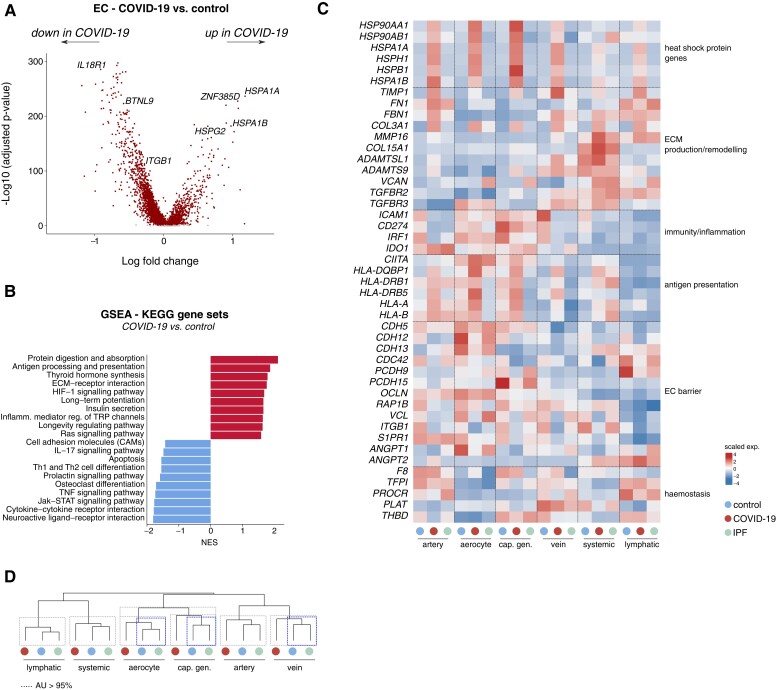
Figure 3.
Transcriptomic rewiring of COVID-19 and IPF ECs. A, Volcano plot comparing differentially expressed genes in ECs from COVID-19 vs. control lungs. Representative genes are indicated; each dot represents a single gene. Red (dark) and grey (light) dots indicate up- or downregulated genes with a false discovery rate (q-value) <0.05 or >0.05, respectively. B, Gene set enrichment analysis in ECs derived from COVID-19 lungs, compared with those from controls, using KEGG gene sets. Red bars (to the right, with a value above 0) indicate upregulated gene sets, blue bars (to the left, with value below 0) indicate downregulated gene sets in COVID-19 ECs. C, Gene expression heatmap of individual genes included in the KEGG gene sets presented in (B), in the indicated cell types and conditions. Colour scale: top (red), high expression; bottom (blue), low expression. EC subtypes were pooled into major artery (EC1–3), aerocyte (EC4), general capillary (cap; EC5–6), vein (EC7–9), systemic (EC11–12), and lymphatic (EC14) subgroups. D, Hierarchical clustering analysis of major (pooled) EC subtypes. Dashed boxes indicate clusters that were resolved by multiscale bootstrapping [approximately unbiased (AU) P-value ≥ 95%]. Transcriptomes of COVID-19 aerocytes, general capillaries and veins were statistically separable from their counterparts in control and IPF lungs (blue (dark) dashed boxes); this was not observed for lymphatic, arterial and systemic ECs. GSEA, gene set enrichment analysis; NES, normalized enrichment score.

