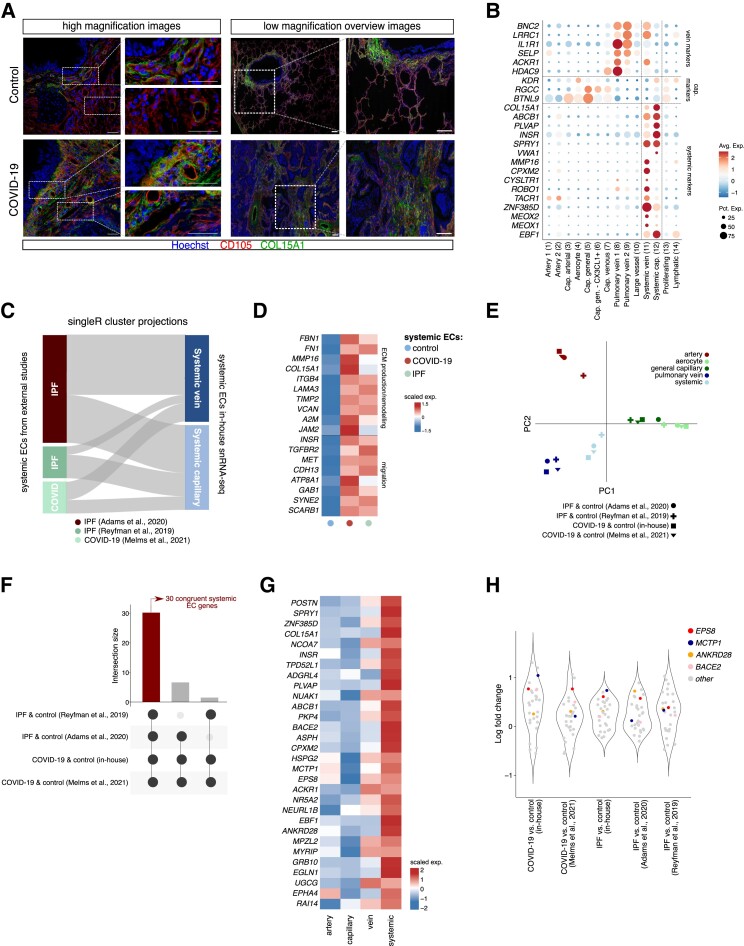
Figure 5.
Systemic vasculature in COVID-19 and IPF lungs. A, Representative immunofluorescent images of lung sections from COVID-19 and control subjects, immunostained for CD105 and COL15A1. Hoechst labels nuclei. High magnification (left) and low magnification overview images (right) are shown. Smaller images to the right of larger images are magnifications of the respective boxed areas. Scale bar: 50 μm in high magnification images and their zoom-in areas. Scale bar: 250 μm in low magnification overview images and their zoom-in areas. B, Dot plot heatmap of the expression of systemic, capillary, and venous EC marker genes. The size and colour intensity of each dot represent, respectively, the percentage of cells within each subcluster expressing the marker gene and the average level of expression of the marker in this subcluster. Colour scale: top (red), high expression; bottom (blue), low expression. C, SingleR annotation of systemic ECs extracted from the indicated publicly available single-cell/nucleus studies, visualized as cluster projections. The top-50 most highly ranking markers of systemic capillary and venous subclusters in our in-house snRNA-seq dataset were used as a reference. D, Gene expression heatmap of individual genes involved in ECM production/remodelling and migration, in the indicated cell types and conditions. Genes were selected from Gene Ontology enrichment analysis, as presented in Supplementary material online, Table S5. Colour scale: top (red), high expression; bottom (blue), low expression. E, PCA of pairwise Jaccard similarity coefficients of top-50 marker genes enriched in different EC subclusters extracted from indicated single-cell studies. Symbols indicate studies, colours indicate EC subclusters. F, UpSet plot of systemic EC-enriched genes across the four different datasets included in the meta-analysis. Black connected dots beneath the graph indicate which studies are intersected. Left (red) bar: 30 intersecting genes commonly enriched in systemic ECs in all studies [false discovery rate (q-value) <0.05]. G, Gene expression heatmap of genes (n = 30) commonly enriched in systemic ECs across studies (see left (red) bar in F), in the indicated EC subtypes identified in our snRNA-seq atlas. Colour scale: top (red), high expression; bottom (blue), low expression. EC subtypes were pooled into major artery (EC1–3), capillary (cap; EC4–6), vein (EC7–9) and systemic (EC11–12) subgroups. H, Violin plots, visualizing the log-fold change distribution of the 30-gene congruent systemic EC signature obtained in (F). Coloured dots indicate genes congruently enriched in COVID-19 vs. control and/or IPF vs. control lungs across all studies included in the analysis; grey dots indicate all other genes in the 30-gene signature.

