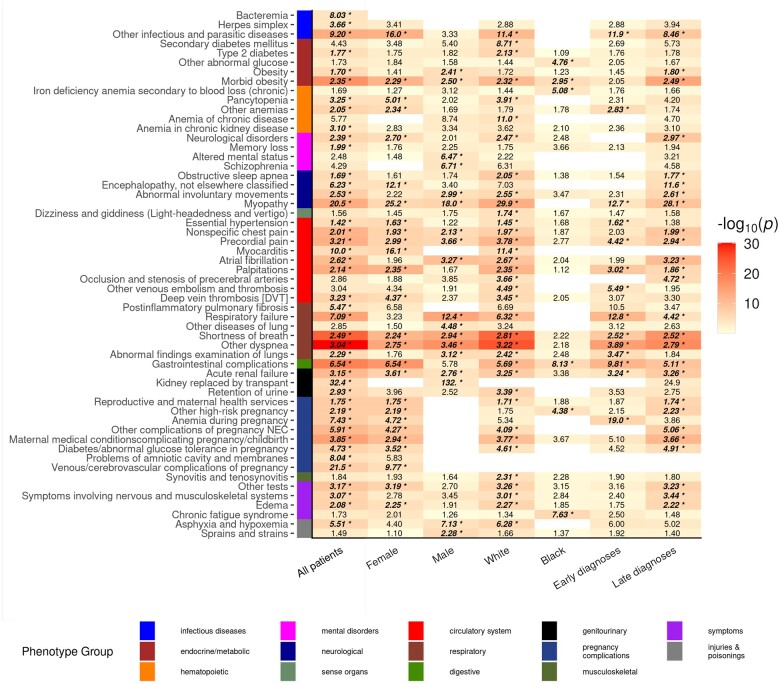
Figure 4.
Temporal-informed phenome scans of postacute COVID-19 by demographic subgroups and timing of postacute diagnoses. PheWAS results for new postacute phenotypes identified by temporal-informed phenotyping among all adults tested for SARS-CoV-2 (left column, n=186 105), stratified by demographic subgroups (male sex, female sex, White non-Hispanic, Black non-Hispanic), and stratified by onset of the new diagnoses (“Early” diagnoses: within 60 days after recovery; “Late diagnoses”: later than 60 days after recovery). The y axis represents phecodes group by chapter within the phecode hierarchy.32 Cell color intensity illustrates adjusted P values by logistic regression. Text in cells show point estimates for effect odds ratios. Text in bold/italic and with a “*” indicate PheWAS associations that were statistically significant using a Bonferroni correction. Results for phecodes with a statistically significant association in any subgroup analysis are displayed. Empty cells indicate analyses with insufficient phenotype cases (<10) to perform the analysis for that phenotype in the subgroup.

