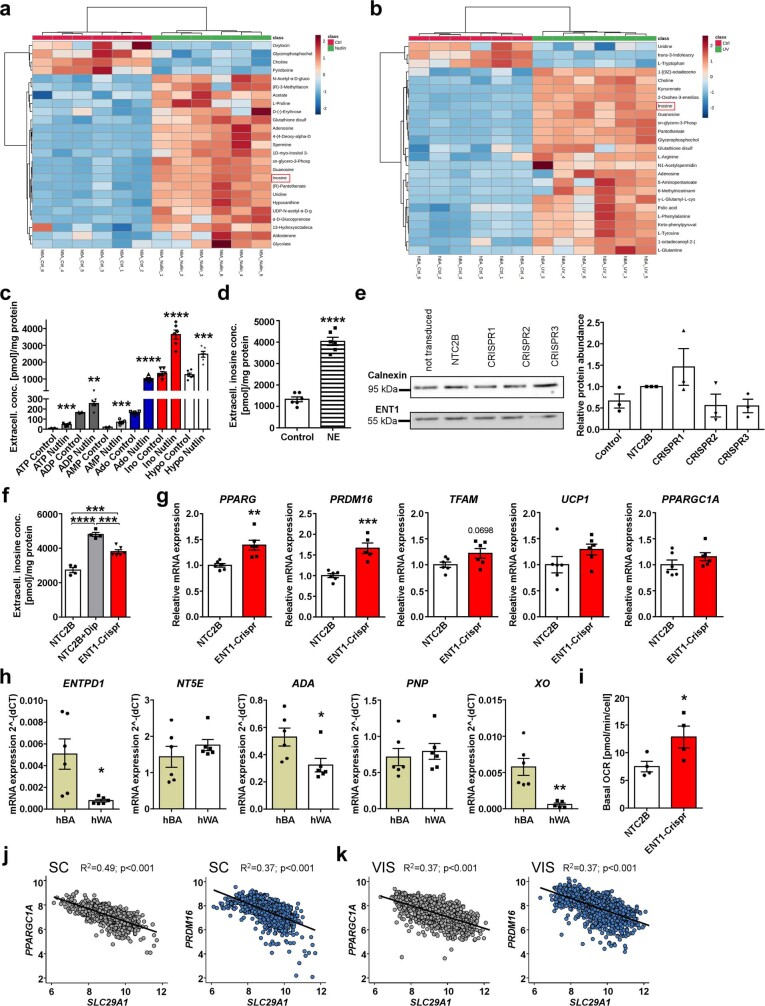
Extended Data Fig. 7. Inosine- and ENT1-mediated effects on human adipocytes.
a, b Heatmap of top 25 secreted metabolites of untargeted metabolomics of human BA: (a) treated with and without nutlin-3 (b) irradiated with UV, upregulated metabolites are shown in red, downregulated metabolites are shown in blue (n = 6). c, Concentrations of purinergic molecules in the supernatant of human BA treated with and without nutlin-3 (n = 6). d, Extracellular inosine concentrations of human BA treated with and without NE (n = 6). e, Representative Western Blot and quantification for ENT1 knockdown in human BA induced by different lentiviral Crispr-Cas9 vectors (CRISPR1, 2, 3) in comparison to a control vector (NTC2B) and to not-transduced (Control) cells (n = 3). Calnexin serves as a loading control. For gel source data see Supplementary Information. f, extracellular inosine concentrations in human BA with (ENT1-Crispr) and without (NTC2B) ENT1 knockdown treated with and without Dipyridamole (Dip) (1µM) (n = 4-6). g, mRNA expression of adipogenic (PPARG) and thermogenic (PRDM16, TFAM, UCP1, PPARGC1A) marker genes in human BA with (ENT1-Crispr) and without (NTC2B) ENT1 knockdown (n = 5-6). h, Expression of the purinergic enzymes ENTPD1, NT5E, ADA, PNP and XO in human brown (hBA) and white (hWA) adipocytes (n = 5-6). i, Basal oxygen consumption rate (OCR) of hWA with (ENT1-Crispr) and without (NTC2B) ENT1 knockdown (n = 4). j, k Linear regression of SLC29A1 and (j) PPARGC1A expression (n = 1,476; ρSpearman = −0.71) and PRDM16 expression (n = 1,476; ρSpearman = −0.64) in human subcutaneous WAT (SC) and (k) PPARGC1A expression (n = 1,583; ρSpearman = −0.6) and PRDM16 expression (n = 1,583; ρSpearman = −0.63) in human visceral WAT (VIS), p-values were corrected for multiple inference using the Holm method. For all: *p < 0.05, **p < 0.01, ***p < 0.005, ****p < 0.001. For exact p-values see Source Data. Data are represented as mean ± s.e.m. Two-tailed t-test was applied for c, d, g, h, i, One-way ANOVA with Tukey’s post hoc test for a, b, e, f.

