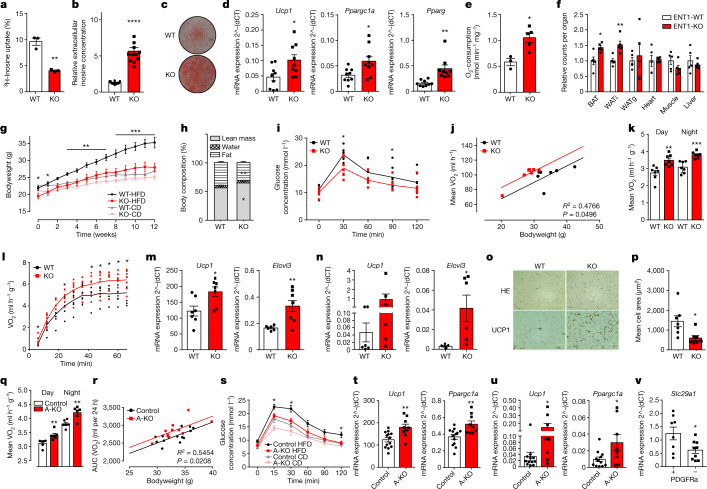
Fig. 2. Role of ENT1 in adipose tissue metabolism.
a–d, Analysis of WT and ENT1−/− (KO) murine brown adipocytes. a, 3H-inosine uptake (n = 3). b, Extracellular inosine concentrations (n = 12). c, Representative Oil Red O staining. d, Expression of Ucp1, Ppargc1a and Pparg (n = 9). e, Oxygen consumption of WT and ENT1-KO BAT (n = 3–5). f, Lipid uptake (14C-triolein) in indicated organs of WT and ENT1-KO mice (n = 5, multiple t-tests). g, Body weight of WT and ENT1-KO mice during control diet (CD) or HFD (n = 7) (summarized P values of HFD groups are shown), h–p, Twelve-week HFD in WT and ENT1-KO mice. h, Body composition (n = 7). i, Glucose tolerance test (n = 7). j, ANCOVA of oxygen consumption/body weight (n = 7). k, Mean oxygen consumption over 24 h at 23 °C (n = 7). l, Oxygen consumption at 4 °C (n = 7). m, Expression of Ucp1 and Elovl3 in BAT (n = 6–7). n, Expression of Ucp1 and Elovl3 in WATi (n = 5–6). o, Representative haematoxylin and eosin and UCP1 staining of WATi (HE n = 7, UCP1 n = 3, scale bar, 100 µm). p, Mean adipocyte area of WATi (n = 7). q–u, Analysis of ENT1-floxed-AdiponectinCre mice. q, Oxygen consumption of 8-week old male mice (n = 6). r, ANCOVA of AUC of oxygen consumption/body weight after 12 weeks of HFD (13 control and 11 ENT1-A-KO mice were analysed). s, Glucose tolerance after 12 weeks of HFD or CD (HFD 13 control and ten ENT1-A-KO mice, CD n = 6) (summarized P values of the HFD groups are shown). t,u, Thermogenic marker expression in (t) BAT (13 control and nine ENT1-A-KO mice). u, WATi (12 control and eight ENT1-A-KO mice) after 12 weeks of HFD. v, Slc29a1 expression in PDGFRα-positive and -negative stromal vascular fraction cells of WATi (n = 8–9). For all: *P < 0.05, **P < 0.01, ***P < 0.005, ****P < 0.001. For exact P values see source data. Data are represented as mean ± s.e.m. Two-tailed t-test was applied except for j,r (ANCOVA, non-linear fit) and g,s (one-way ANOVA with Tukey’s post hoc test).

