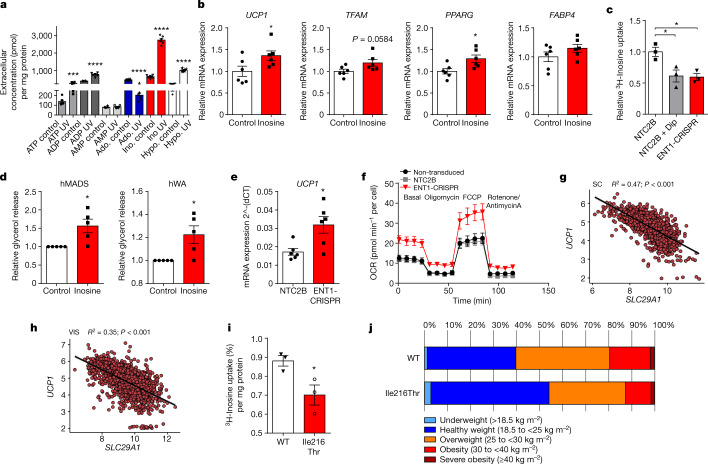
Fig. 3. Regulation of human adipocytes by inosine and SLC29A1.
a, Concentrations of purinergic molecules in the supernatant of human brown adipocytes after UV irradiation (n = 6). b, Expression of thermogenic (UCP1, TFAM) and adipogenic (PPARG, FABP4) marker genes in human brown adipocytes treated with and without inosine (n = 6). c, 3H-Inosine uptake in human brown adipocytes with (ENT1-CRISPR) and without (NTC2B) ENT1 knockdown treated with and without dipyridamole (Dip) (1 µM) (n = 3). d, Lipolysis of human beige (hMADS) and human white adipoctyes (hWA) treated with and without inosine (300 nM) (n = 5). e, UCP1 expression of hWA with (ENT1-CRISPR) and without (NTC2B) ENT1 knockdown (n = 6). f, Oxygen consumption rate (OCR) of hWA with (ENT1-CRISPR) and without (NTC2B) ENT1 knockdown (n = 4). g,h, Linear regression between SLC29A1 and UCP1 expression in human subcutaneous WAT (subcutaneous, SC) (g) (n = 1,476; ρ = −0.72) and human visceral WAT (visceral, VIS) (h) (n = 1,583; ρ = −0.61), P values were corrected for multiple inference using the Holm method. i, 3H-inosine uptake of HEK293T cells overexpressing either the ENT1-WT or Ile216Thr variant (n = 3). j, BMI of Ile216Thr variant carriers (Ile/Thr and Thr/Thr) compared to the Ile/Ile homozygous participants (n(Ile/Thr) = 72, n(Thr/Thr) = 822). For all: *P < 0.05, **P < 0.01, ***P < 0.005, ****P < 0.001. For exact P values see source data. Data are represented as mean ± s.e.m. A two-tailed t-test was applied for a,b,d,e,i and one-way ANOVA with Tukey’s post hoc test for c.

