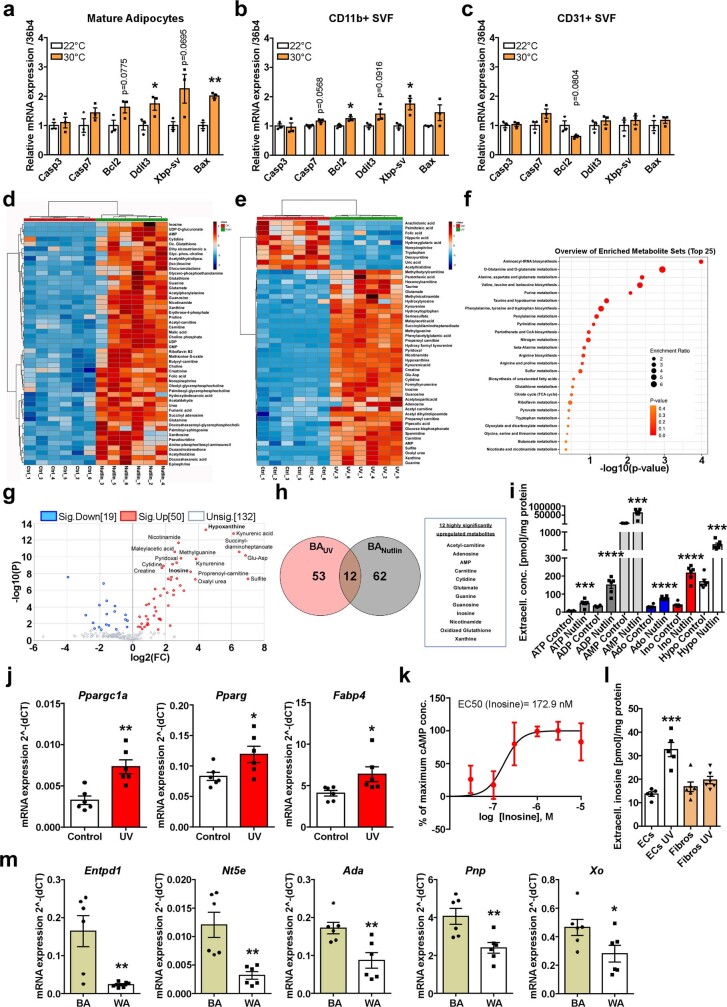
Extended Data Fig. 1. Secreted factors of apoptotic murine brown adipocytes.
a–c, Mature adipocytes, CD11b+ myeloid cells and CD31+ endothelial cells were isolated from BAT of mice housed at 22 °C or at 30 °C (thermoneutrality) for 3 days. Gene expression of apoptotic marker genes in (a) mature adipocytes, (b) CD11b+ myeloid cells, (c) CD31+ endothelial cells (n = 3). d–h, Untargeted metabolomics of apoptotic BA. d, Heatmap of top 50 secreted metabolites accumulated in the supernatant after nutlin-3 treatment, upregulated metabolites: red, downregulated metabolites: blue (n = 6). e, Heatmap of top 50 secreted metabolites after UV irradiation (n = 6). f, Qualitative enrichment analysis of metabolic pathways of secreted metabolites of BA after UV irradiation based on the KEGG metabolic pathways, g, Volcano plot of secreted metabolites after UV treatment of BA (n = 6). h, Venn diagram and shared metabolite list identified across all highly significantly (p < 0.01) up- or down-regulated metabolites after UV or nutlin-3 treatment. i, Extracellular concentrations of purinergic molecules of BA after nutlin-3 treatment (n = 6). j, Expression of Ppargc1a, Pparg and Fabp4 in BA after treatment with the apoptotic supernatant described in Fig. 1d (n = 6). k, cAMP dose-response curve of inosine (n = 3). l, Extracellular inosine concentrations of murine mesenchymal endothelial cells (EC) and murine BAT-derived fibroblasts (Fibros) after UV irradiation (n = 5-6). m, Expression of the ATP-degrading enzymes Entpd1, Nt5e, Ada, Pnp, Xo in murine brown (BA) and white (WA) adipocytes (n = 6). For all: *p < 0.05, **p < 0.01, ***p < 0.005, ****p < 0.001. For exact p-values see Source Data. Data are represented as mean ± s.e.m. Two-tailed t-test was applied for a–c, i, j, l, m; One-way ANOVA with Tukey’s post hoc test for g, h.

