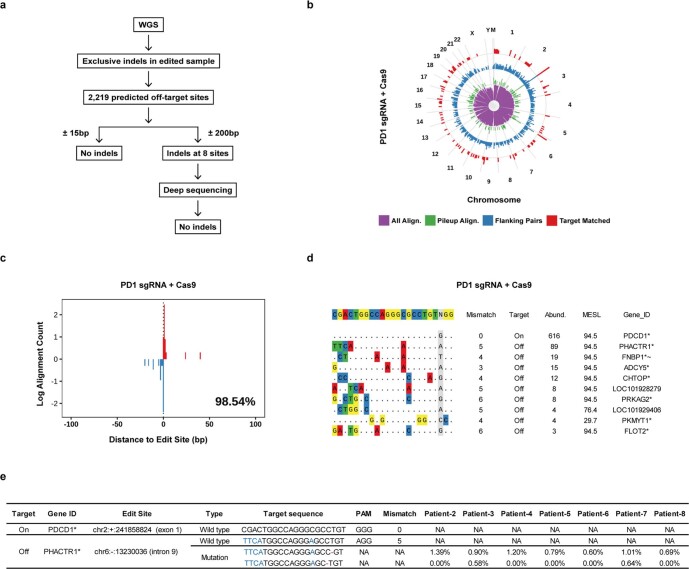
Extended Data Fig. 6. Off-target detection in non-viral PD1-integrated CAR-T cell products.
a, Off-target detection by whole genome sequencing (WGS) and deep sequencing. The genomic DNA of untreated T cells and the infusion product of patient-2 was subjected to 100× WGS. A total of 2,219 potential off-target sites (not including those around the on-target site) were predicted by Cas-OFFinder and compared with exclusive indels in the edited sample by bioinformatics. No indel events were detected within 15bp upstream and downstream (±15bp) of the sites. Indels were found within 200bp upstream and downstream (±200bp) of eight sites. Deep sequencing (10,000× coverage) was then performed to validate these indel events. While no indels were detected at five sites, indels at the other three sites were variances of one unit length on nucleotide repeats and thus were not considered to be true off-target events. b-e, Identification of off-target sites by iGUIDE. b, Genomic distribution of oligonucleotide (dsODN) incorporation sites by bioinformatic characteristics. The ring indicates the human chromosomes aligned end-to-end, plus the mitochondrial chromosome (labeled M). The frequency of cleavage and subsequent dsODN incorporation is shown on a log scale on each ring (pooled over 10 Mb windows). The purple inner most ring plots all alignments identified. The green ring shows three or more unique alignments that overlap with each other (pileup alignment). The blue ring shows alignments that can be found on either side of a dsODN incorporation site (flanking pairs). The red ring shows reads with matches to the gRNA (allowing < 6 mismatches) within 100 bp (target matched). c, Distance distribution of identified incorporation sites from the PD1 on-target locus. The percentage of incorporations within 100 bp of the on-target site is shown. d, Potential off-target cleavage sites identified by iGUIDE. Abund., the total number of unique alignments associated with the site. MESL, maximum edit site likelihood. Gene_ID, an identifier indicating the nearest gene. Symbols after the gene name indicate: * the site is within the transcription unit of the gene, ~ the gene appears on the cancer-association list. e, Deep sequencing (50,000× coverage) to validate off-target events at the PHACTR1 site in different infusion products.

