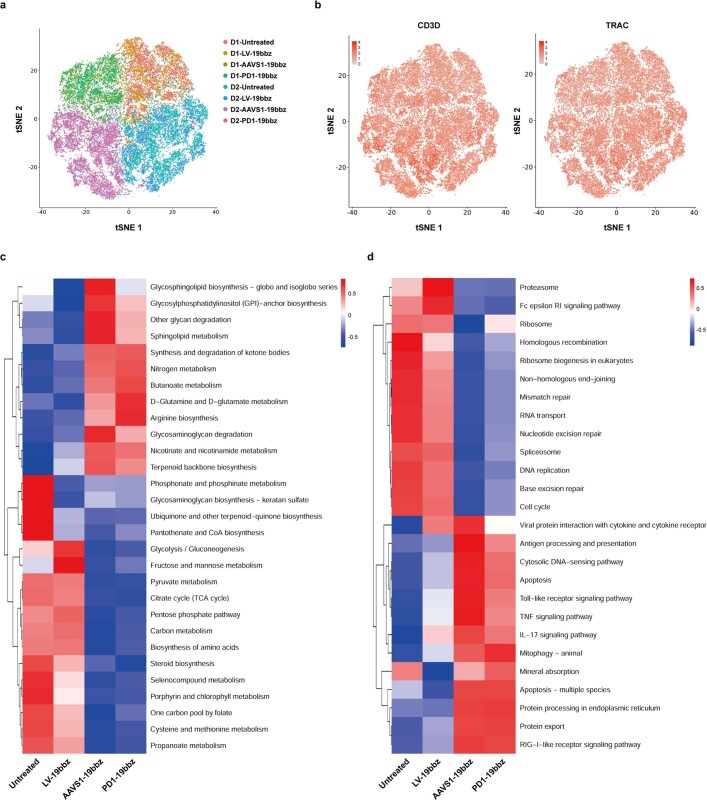
Extended Data Fig. 10. Single-cell RNA sequencing analysis of T cells collected shortly after preparation by different methods.
Single-cell RNA sequencing was applied to analyse the characteristics of T cells collected 4 h after preparation by different methods. a, Overview of the 46,558 cells that passed QC for single-cell analysis. Cells are color coded by sample, respectively, in the tSNE plot. b, Expression of T cell marker genes (CD3D, TRAC) in the tSNE plots. c-d, Metabolism (c) and other (d) pathway activities in T cells were scored using the quantitative set analysis for gene expression (QuSAGE) method.

