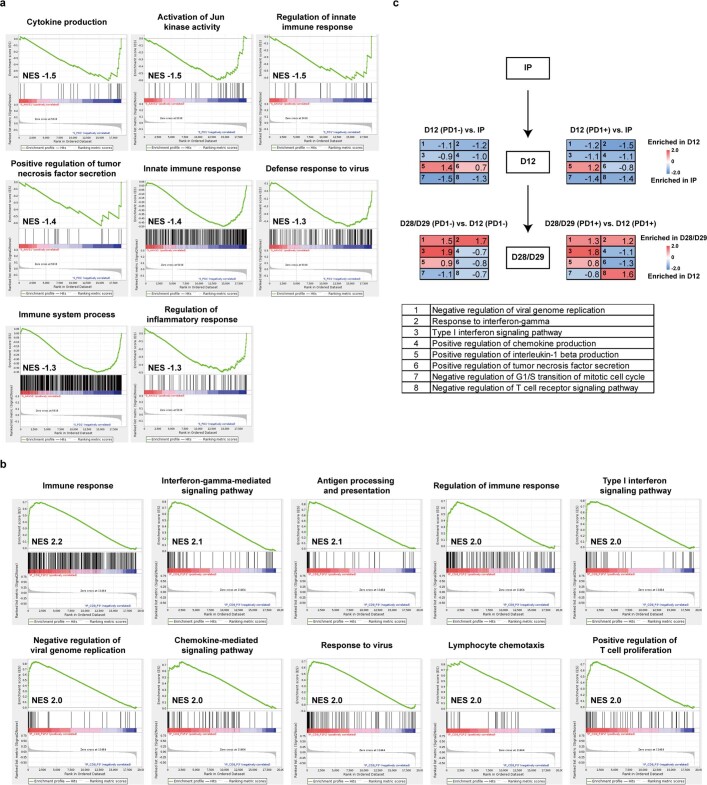
Extended Data Fig. 11. Gene set enrichment analysis of non-viral PD1-integrated CAR-T cells.
a, Gene set enrichment analysis (GSEA) of CD8+ T cells comparing AAVS1-19bbz and PD1-19bbz cells. Enriched gene sets in PD1−19bbz cells and the normalized enrichment score (NES) are shown. b, GSEA of CD8+ T cells comparing the infusion products of patients with different prognosis (patient-1/patient-2, better prognosis; patient-3, worse prognosis). The top ten most enriched gene sets in patient-1/patient-2 group and the NES are shown. c, GSEA comparing different time point samples from patient-1 and patient-2 before and after infusion. CD8+ cells were analysed in the infusion products (IP). CD8+/CAR+/PD1− (left) and CD8+/CAR+/PD1+ (right) cells were analysed in D12 and D28/D29 samples after infusion, respectively. The serial numbers and names of enriched gene sets and the NES are shown. Positive values of the NES (red) represented the enrichment of gene sets in D12 (vs. IP) and D28/D29 (vs. D12) samples. Negative values of the NES (blue) represented the enrichment of gene sets in IP (vs. D12) and D12 (vs. D28/D29) samples. The patient-3 samples were not subjected to this analysis owing to an unreliable low CAR+ cell number in D28 sample.

