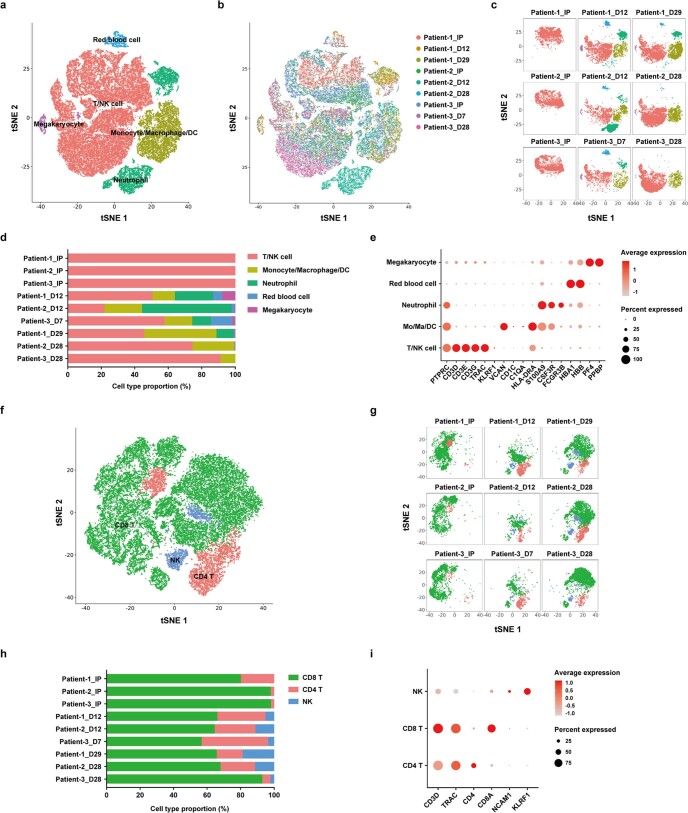
Extended Data Fig. 12. Landscape of cell types in single-cell RNA sequencing analysis of patient samples.
a-b, Overview of the 54,774 cells that passed QC for single-cell analysis. Cells are color coded by cell type (a) and sample (b), respectively, in the tSNE plots. c, tSNE plots showing cell clusters in each sample. d, Proportion of cell types in each sample. e, Bubble heat map showing marker gene expression for different cell types. f, Overview of the 36,201 cells in the T/NK cell cluster. Cells are color coded by cell type in the tSNE plot. g, tSNE plots showing subtypes in the T/NK cell cluster in each sample. h, Proportion of subtypes in the T/NK cell cluster in each sample. i, Bubble heat map showing marker gene expression for different subtypes in the T/NK cell cluster.

