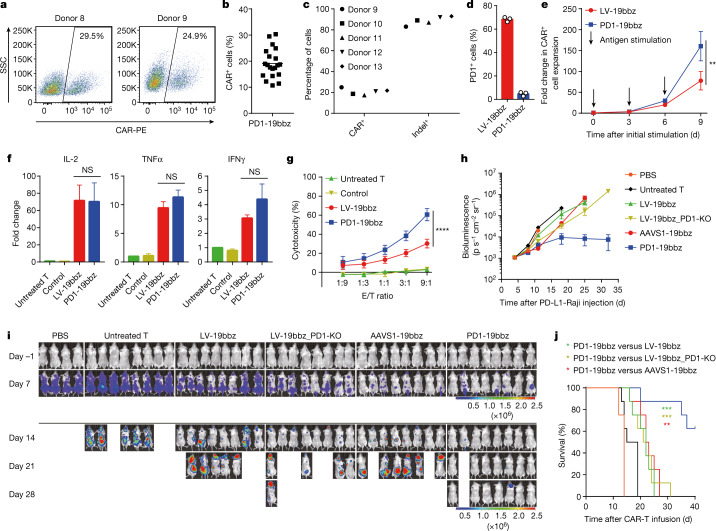
Fig. 2. Non-viral, PD1-integrated CAR-T cells outperform lentivirus-produced CAR-T cells.
a, CAR expression in cells from two representative healthy donors determined 7 d after electroporation. b, Percentage of CAR+ cells detected 7 d after electroporation (n = 20 independent healthy donors). c, Percentages of CAR integration and PD1 indels in total T cells detected 7 d after electroporation in five representative healthy donors. d, Percentage of cells with PD1 expression detected by flow cytometry in CD3+CAR+ gated cells after 24 h of co-culture with PD-L1-expressing Raji cells (n = 3 independent healthy donors). e, Expansion of CAR+ cells after repeated stimulation with PD-L1-expressing Raji cells. Data are shown as the mean ± s.e.m. (n = 3 independent healthy donors). f, Cytokine secretion measured by bead-based immunoassay in the supernatant after co-culture with PD-L1-expressing Raji cells for 24 h. Data are shown as the mean ± s.e.m. (n = 3 independent healthy donors). g, In vitro cytotoxicity against PD-L1-expressing Raji cells determined by LDH assay. Data are shown as the mean ± s.e.m. (n = 3 independent healthy donors). h–j, Immunodeficient mice were injected intravenously with 5 × 10⁵ ffLuc-transduced PD-L1-expressing Raji cells, and 1 × 10⁶ CAR-T cells were administered intravenously after 5 d. h,i, Bioluminescence kinetics (h) and imaging (i) of tumour cell growth following different treatments (n = 4 or 8). Data are shown as the mean ± s.e.m. in h. Imaging on the indicated days after CAR-T cell infusion and the radiance scale (p s–1 cm–2 sr–1) are shown in i. j, Kaplan–Meier analysis of survival of the mice in i. Control samples were electroporated the same as PD1-19bbz cells except without sgRNA addition. The mean value is shown in b,d. P values were calculated by one-way ANOVA with Tukey’s multiple-comparisons test (f), two-way ANOVA with Sidak’s multiple-comparisons test (e) or Tukey’s multiple-comparisons test (g), or a log-rank Mantel–Cox test (j). ****P < 0.0001, **P < 0.01; NS, not significant.

