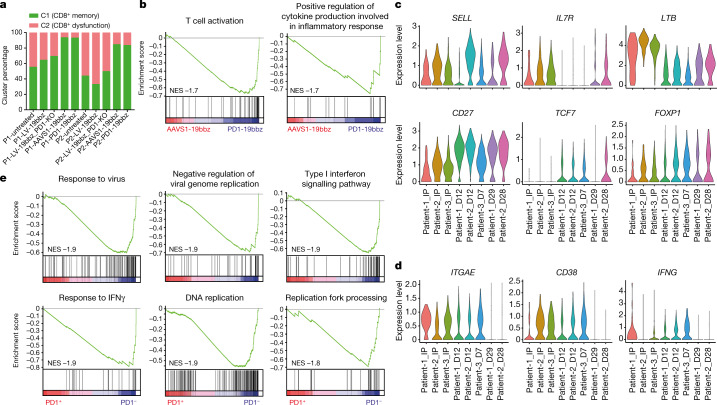
Fig. 4. scRNA-seq analysis of non-viral, PD1-integrated CAR-T cells.
a, Percentages of cluster 1 (C1) and cluster 2 (C2) in two donor samples prepared by different methods. C1 and C2 were generated by clustering cells on the basis of expression of CD8+ memory and dysfunction/cytotoxicity marker genes, respectively. P1, patient 1; P2, patient 2. b, GSEA of CD8+ T cells comparing AAVS1-19bbz and PD1-19bbz cells. Enriched gene sets in PD1-19bbz cells and the normalized enrichment score (NES) are shown. c,d, Violin plots showing the expression of memory (c) and dysfunction/cytotoxicity (d) genes in CD8+CAR+ cells from three patients before and after infusion. Data for the sample from patient 3 taken after 28 d of treatment are not shown owing to an unreliable low CAR+ cell number. D, days after infusion; IP, infusion product. e, GSEA comparing CD8+CAR+PD1+ and CD8+CAR+PD1– cells from three patients after 7 or 12 d of infusion. The top six most enriched gene sets in CD8+CAR+PD1– cells and the NES are shown.

