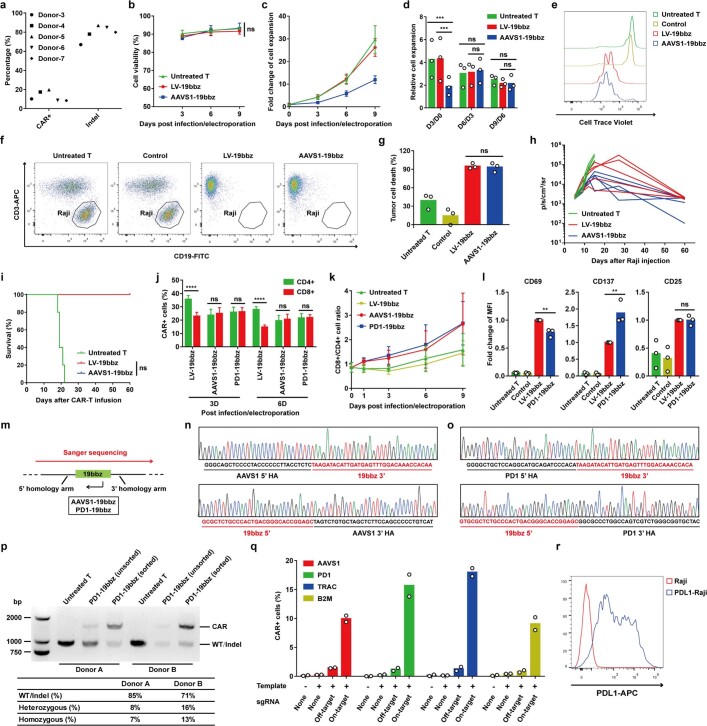
Extended Data Fig. 2. Comparison of non-viral gene-specific integrated CAR-T cells and lentivirus-produced CAR-T cells.
a, Percentages of CAR integration and AAVS1 indels in total T cells were detected 7 days after electroporation in five representative healthy donors. b, Cell viability detected by trypan blue staining on indicated days post infection/electroporation. Data are mean ± SEM (n = 3 independent healthy donors). c-d, Absolute (c) and relative (d) rates of T cell growth in vitro (n = 3 independent healthy donors). Data are mean ± SEM in c. e, Representative histogram showing Cell Trace Violet staining of T cells after co-culture with mitomycin C-treated Raji cells for 5 days. This experiment was repeated at least three times using different donors. f-g, In vitro cytotoxicity against Raji cells determined by flow cytometry. f, Representative plots showing lysis of Raji cells following 18 h co-culture. g, The percentage of Raji tumor cell death detected by flow cytometry-based cytotoxicity assay (n = 3 independent healthy donors). h, Bioluminescence kinetics of tumor cell growth following different treatments (n = 5). Immunodeficient mice were injected intravenously with 2×10⁵ ffLuc-transduced Raji cells and 2×10⁶ CAR-T cells were administered intravenously after 5 days. i, Kaplan-Meier analysis of survival of mice in h. j, Percentages of CAR+ cells in CD4+ and CD8+ cells determined 3 or 6 days after infection/electroporation. Data are mean ± SEM (n = 4 independent healthy donors). k, Ratio of CD4+ and CD8+ cells on indicated days post infection/electroporation. Data are mean ± SEM (n = 3 independent healthy donors). l, MFI of CD69, CD137 and CD25 expression in T cells detected by flow cytometry after 24 h co-culture with PD-L1 expressing Raji cells (n = 3 independent healthy donors). m, For the samples of AAVS1-19bbz and PD1-19bbz, CAR+ cells were sorted by fluorescence-activated cell sorting (FACS). Genomic DNA was used as template to amplify PCR products across the homology arms. Sanger sequencing was performed from end to end, outside of homology arms. n-o, Sequences of 5’ and 3’ junction sites between the homology arm and CAR cassette at the AAVS1 (n) and PD1 (o) locus. p, Genotyping of PD1-19bbz cells in two independent healthy donors by calculating the intensity ratio of WT/indel and CAR specific bands in unsorted and sorted CAR+ cells. WT, wild type. q, Non-specific integration of CAR elements was tested 7 days after electroporation by using recombinant spCas9 and different combinations of DNA template and sgRNA (n = 2 independent healthy donors). For the groups of AAVS1, PD1 and TRAC templates, one B2M sgRNA with high cleavage efficiency was used as off-target sgRNA. For the B2M template group, one TRAC sgRNA with high cleavage efficiency was used as off-target sgRNA. The off-target groups were designed to detect non-targeted integration under a hypothesized condition that sgRNA had very high off-target cleavage efficiency. r, PD-L1 expression in Raji cell lines. Control samples were electroporated the same as AAVS1-19bbz or PD1-19bbz cells except without sgRNA addition. CD3+ (Untreated T, Control) or CD3+/CAR+ (LV-19bbz, AAVS1-19bbz, PD1-19bbz) gated cells were analysed in e, l. Mean value is shown in d, g, l, q. P values were calculated by one-way ANOVA with Tukey’s multiple comparisons test (g, l), two-way ANOVA with Tukey’s multiple comparisons test (b, d) and Sidak’s multiple comparisons test (j) or log-rank Mantel-Cox test (i).

