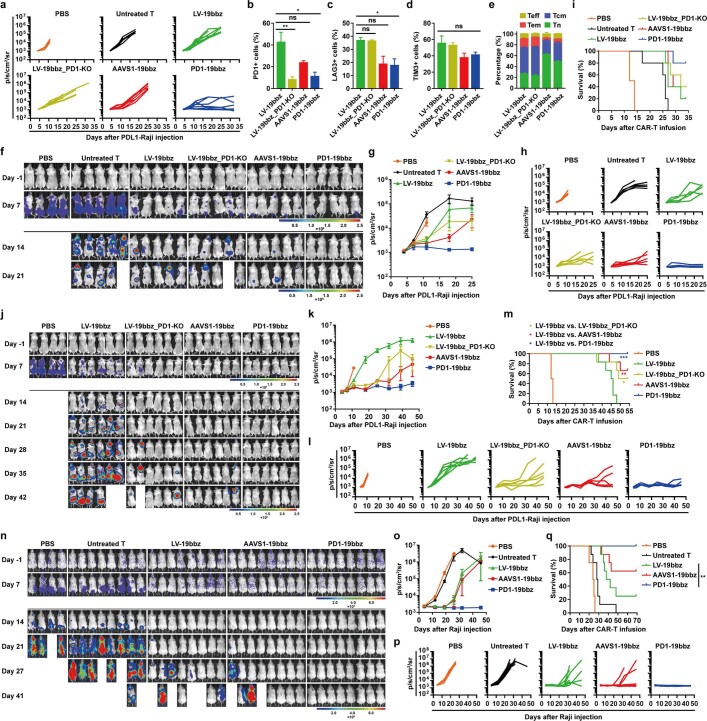
Extended Data Fig. 4. Non-viral PD1-integrated CAR-T cells effectively eradicate tumor cells with either high or low PD-L1 expression at a low or high infusion dose.
a-e, Immunodeficient mice were injected intravenously with 5 × 10⁵ ffLuc-transduced PD-L1 expressing Raji cells and 1×10⁶ CAR-T cells were administered intravenously after 5 days. a, Bioluminescence kinetics of tumor cell growth in each treatment group (n = 4 or 8). b-d, Percentages of PD1, LAG3 and TIM3 expression in peripheral CAR-T cells detected 7 days after CAR-T cell infusion. Data are mean ± SEM (n = 3). e, After CAR-T cell infusion for 7 days, the T cell subset differentiation in peripheral CAR-T cells was analysed according to CD45RO/CD62L expression by flow cytometry. Data are mean ± SEM (n=3). f-i, Immunodeficient mice were injected intravenously with 5×10⁵ ffLuc-transduced PD-L1 expressing Raji cells and 2 × 10⁶ CAR-T cells were administered intravenously after 5 days. The T cells were harvested from the same healthy donor as that in Fig. 2h–j and a–e. f-h, Bioluminescence imaging (f) and kinetics (g, h) of tumor cell growth following different treatments (n = 4 or 5). Data are mean ± SEM in g. i, Kaplan-Meier analysis of survival of mice in f. j-m, Immunodeficient mice were injected intravenously with 5×10⁵ ffLuc-transduced PD-L1 expressing Raji cells and 2×10⁶ CAR-T cells were administered intravenously after 5 days. The T cells were harvested from one healthy donor who was different from that in Fig. 2h-j and a–i. j-l, Bioluminescence imaging (j) and kinetics (k, l) of tumor cell growth following different treatments (n = 4 or 6). Data are mean ± SEM in k. m, Kaplan-Meier analysis of survival of mice in j. n-q, Immunodeficient mice were injected intravenously with 2×10⁵ ffLuc-transduced Raji cells and 1×10⁶ CAR-T cells were administered intravenously after 5 days. n-p, Bioluminescence imaging (n) and kinetics (o, p) of tumor cell growth following different treatments (n = 4 or 8). Data are mean ± SEM in o. q, Kaplan-Meier analysis of survival of mice in n. The imaging on indicated days after CAR-T cell infusion and the radiance scale (p/s/cm2/sr) are shown (f, j, n). P values were calculated by one-way ANOVA with Tukey’s multiple comparisons test (b-d) or log-rank Mantel-Cox test (m, q).

