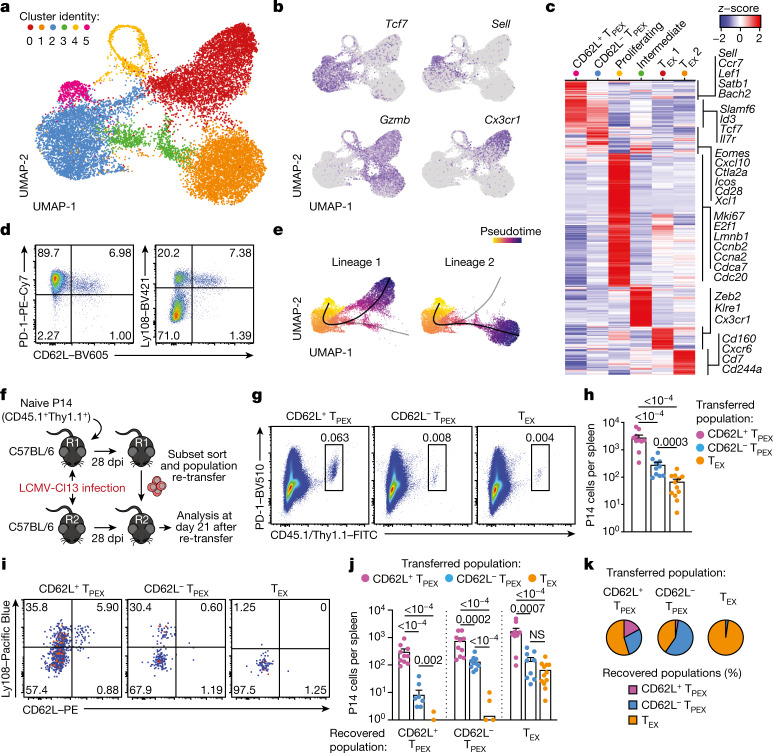
Fig. 1. CD62L marks transcriptionally distinct and functionally superior TPEX cells during chronic infection.
a–c, Naive wild-type mice were infected with LCMV-Cl13 and TPEX-cell-enriched (PD-1+TIM-3lo) CD8+ T cells were sorted and subjected to scRNA-seq at 30 dpi. The resulting data were combined with publicly available scRNA-seq datasets from mouse exhausted CD8+ T cells11,19 and analysed. a, Uniform manifold approximation and projection (UMAP) plot of 15,743 single exhausted T cells coloured according to cluster classification. b, Normalized gene expression of Tcf7, Sell, Gzmb and Cx3cr1 projected onto the UMAP. c, Heat map showing the expression of all identified cluster signature transcripts. d, Congenically marked naive P14 cells were transferred into recipient mice, which were subsequently infected with LCMV-Docile and analysed at 21 dpi. Flow cytometry plots show the expression of PD-1, Ly108 and CD62L in splenic P14 T cells. e, UMAP plot showing two predicted developmental trajectories generated using Slingshot analysis. Cells are colour-coded on the basis of pseudotime prediction. f–k, Congenically marked naive P14 T cells were transferred into primary recipient (R1) mice, which were then infected with LCMV-Cl13. The indicated subsets of P14 T cells were sorted at 28 dpi and 3 × 10³–15 × 103 cells were re-transferred to infection-matched secondary recipient (R2) mice. Splenic P14 T cells of R2 mice were analysed at day 21 after re-transfer. f, Schematic of the experimental set-up. g,h, Flow cytometry plots (g) and cell numbers (h) of recovered progenies at day 21 after re-transfer (gated on CD4−CD19− cells). i–k, Flow cytometry plots (i), numbers (j) and average percentages (k) of recovered CD62L+ TPEX, CD62L− TPEX and TEX cells per spleen in R2 mice. Cells were gated on P14 cells (day 21 after re-transfer). Dots in graphs represent individual mice (h,j); horizontal lines and error bars of bar graphs indicate mean and s.e.m., respectively. Data are representative of at least two independent experiments. P values are from Mann–Whitney tests (h,j); P > 0.05, not significant (NS).

