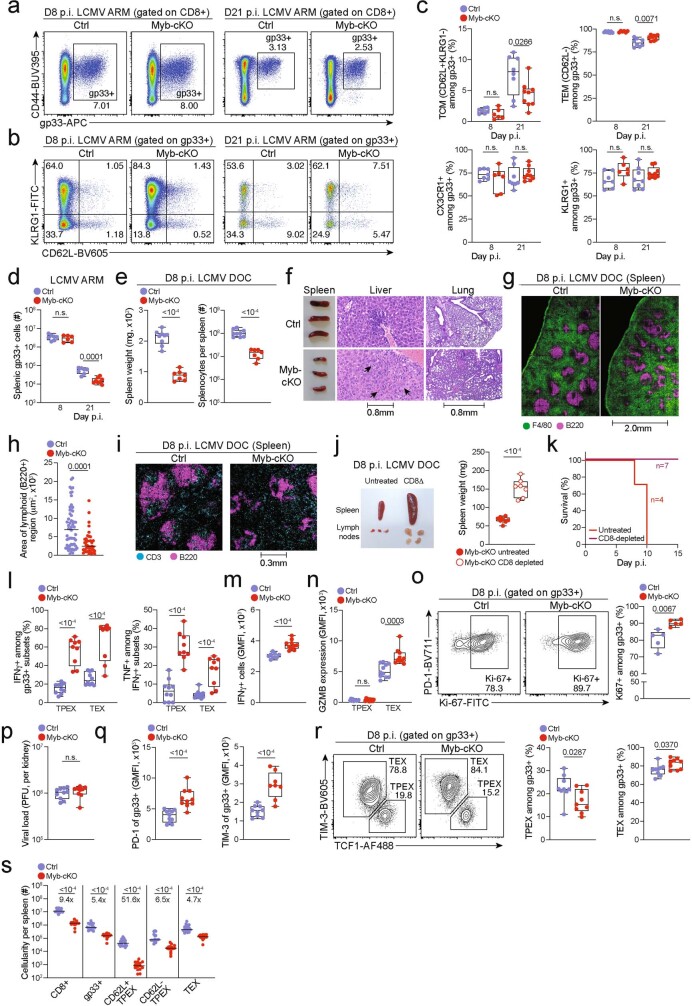
Extended Data Fig. 7. MYB is required to limit CD8+ T cell expansion and cytotoxicity in response to chronic infection.
(a–s) Mybfl/flCd4Cre (Myb-cKO) mice and littermate Mybfl/fl control mice (Ctrl) were infected with either LCMV-Armstrong (a–d) or LCMV-Docile (e–s). (a–b) Flow cytometry plots showing (a) splenic antigen-specific (gp33+) CD8+ cells and (b) expression of CD62L and KLRG1 among antigen-specific cells in Myb-cKO and control mice at indicated time points post LCMV-Armstrong infection. (c) Quantification of central memory (TCM), effector memory (TEM), CX3CR1+ and KLRG1+ cells among gp33+ CD8+ cells in Myb-cKO and control mice at indicated time points post LCMV-Armstrong infection. (d) Numbers of splenic gp33+CD8+ T cells in Myb-cKO and control mice at indicated time points post LCMV-Armstrong infection. (e) Box plots showing the weights of spleens (left) and the total numbers of splenocytes (right) in Myb-cKO and control mice at day 8 post LCMV-Docile infection. (f) Spleen size (left) and haematoxylin and eosin staining of sections showing infiltration of immune cells (arrows) in livers (middle) and lungs (right) in Myb-cKO and control mice at 8 dpi. (g) Confocal images of F4/80 and B220 expression in frozen spleen sections and (h) quantification showing the cellular organization and area of lymphoid regions in Myb-cKO and control mice at day 8 post LCMV-Docile infection. (i) Confocal images of CD3 and B220 expression in frozen spleen sections showing the distribution of B and T cells in the spleens of Myb-cKO and control mice at day 8 post LCMV-Docile infection. (j) Image and box plot showing the size and weights of spleens in untreated and CD8+ T-cell-depleted Myb-cKO mice at day 8 post LCMV-Docile infection. (k) Survival curve of CD8-depleted Myb-cKO mice post LCMV-Docile infection. (l) Proportion of cytokine-producing antigen-specific TPEX and TEX cell subsets after gp33 peptide restimulation of Myb-cKO and control mice at day 8 post LCMV-Docile infection. (m, n) Quantification of IFNγ expression (m), and granzyme B (GZMB) expression in TPEX and TEX cells (n) in Myb-cKO and control mice at day 8 post LCMV-Docile infection. (o) Flow cytometry plots and quantification showing the proportions of Ki67+ within the gp33+ compartment in Myb-cKO and control mice at day 8 post LCMV-Docile infection. (p) Box plots showing viral titres in the kidneys of Myb-cKO and control mice at day 8 post LCMV-Docile infection. (q) Box plots showing the expression of PD-1 (left) and TIM-3 (right) among gp33+ CD8+ T cells of control and Myb-cKO mice at day 8 post LCMV-Docile infection. (r) Flow cytometry plots and quantification show the frequencies of TPEX cells (TCF1+TIM-3−) and TEX cells (TCF1-TIM-3+) among splenic gp33+ CD8+ T cells of Myb-cKO and control mice. (s) Quantification showing the absolute numbers of splenic CD8+, gp33+, CD62L+ TPEX, CD62L− TPEX and TEX cells in Myb-cKO and control mice at day 8 post LCMV-Docile infection. GMFI, geometric mean fluorescence intensity. Dots in graphs represent individual mice; box plots indicate range, interquartile and median; horizontal lines in (h) indicate median. Data are representative of two independent experiments (c–e, k–r) or all mice (j, s) and images (h) analysed; P > 0.05, not significant (n.s.).

