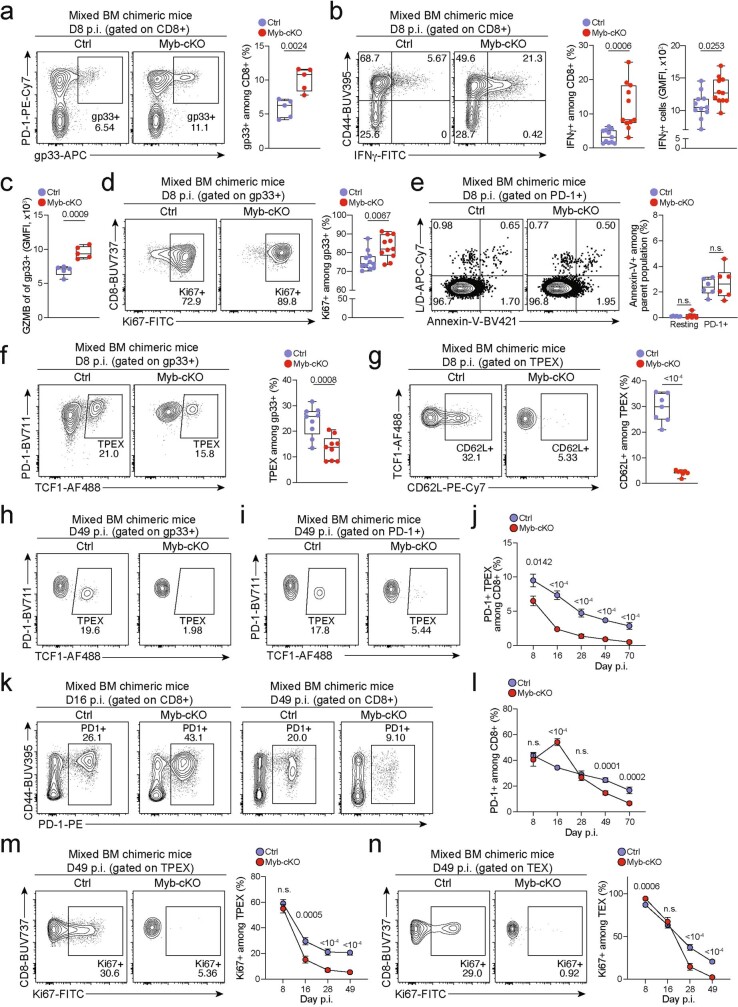
Extended Data Fig. 8. MYB limits CD8+ T cell expansion and cytotoxicity during chronic infection in a cell-intrinsic manner.
(a–n) Naive CD45.1 mice were lethally irradiated and reconstituted using a mixture of Mybfl/flCd4Cre (Myb-cKO) and Cd4Cre or littermate Mybfl/fl control (Ctrl) bone marrow. Chimeric mice were subsequently infected with LCMV-Docile and analysed at the indicated time points after infection. Quantification showing the frequencies of (a) polyclonal antigen-specific gp33+ cells among Myb-cKO and control CD8+ T cells at 8 dpi. (b) Flow cytometry plots and quantification of IFNγ+ cells among Myb-cKO and control CD8+ T cells after peptide restimulation in vitro at 8 dpi. (c) Quantification of GZMB expression among gp33+ cells of the indicated genotypes. (d, e) Flow cytometry plots and quantification showing the frequencies of (d) Ki67+ cells and (e) annexin-V+ cells among Myb-cKO and control antigen-responsive CD8+ T cells. (f, g) Flow cytometry plots and quantification showing the frequencies of TCF1+ TPEX cells among antigen-specific T cells (f) and CD62L+ cells among TPEX cells (g) in Myb-cKO and control compartments at 8 dpi. (h) Flow cytometry plots showing the frequencies of TPEX cells among gp33+ cells at 49 dpi. (i–j) Flow cytometry plots (i) and quantification (j) showing kinetics of splenic polyclonal PD-1+ TPEX cells among Myb-cKO and control CD8+ T cells after infection. (k–l) Flow cytometry plots (k) and quantification (l) showing the frequencies of the entire antigen-responsive PD-1+ cell compartment among Myb-cKO and control CD8+ T cells at indicated time points after infection. (m, n) Flow cytometry plots and quantifications showing the frequencies of Ki67+ cells among Myb-cKO and control polyclonal TPEX (m) and TEX (n) cells at indicated time points after infection. GMFI, geometric mean fluorescence intensity. Dots in graphs represent individual mice; box plots indicate range, interquartile and median. Symbols and error bars represent mean and s.e.m., respectively. All data are representative of two independent experiments. P values are from two-tailed unpaired t-tests (a–g) and Mann–Whitney tests (j–n); P > 0.05, not significant (n.s.).

