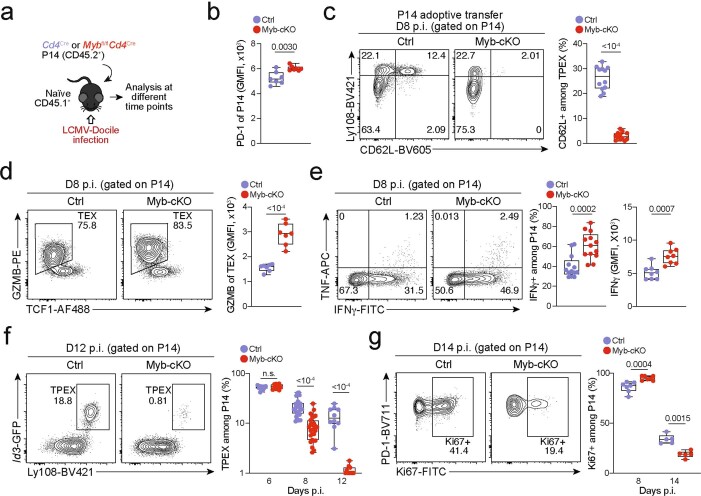
Extended Data Fig. 9. MYB limits proliferation and cytotoxicity and sustains the long-term self-renewal of exhausted CD8+ T cells.
(a–g) Congenically marked naive control (Cd4Cre) and Mybfl/flCd4Cre (Myb-cKO) P14 T cells were adoptively transferred into naive recipient mice, which were subsequently infected with LCMV-Docile. Splenic P14 T cells were analysed at indicated time points post-infection (p.i). (a) Schematic of the experimental set-up. (b) Box plot showing PD-1 expression of transferred P14 cells at 8 dpi. (c) Flow cytometry plots and quantification showing frequencies of CD62L+ cells among Myb-cKO and control P14 TPEX cells. (d) Flow cytometry plots and quantification showing the expression of granzyme B (GZMB) in Myb-cKO and control TEX P14 cells at 8 dpi. (e) Flow cytometry plots and quantifications showing the production of cytokines as indicated from Myb-cKO and control P14 T cells after gp33 peptide restimulation at 8 dpi. (f) Flow cytometry plots and quantification showing the frequencies of TPEX cells among Myb-cKO and control P14 T cells at the indicated time points after infection. (g) Flow cytometry plots and quantification showing the frequencies of Ki67+ cells among Myb-cKO and control P14 T cells at indicated time points after infection. GMFI, geometric mean fluorescence intensity. Dots in graphs represent individual mice; box plots indicate range, interquartile and median; Data are representative of two independent experiments (b–g). P values are from two-tailed unpaired t-tests; P > 0.05, not significant (n.s.).

