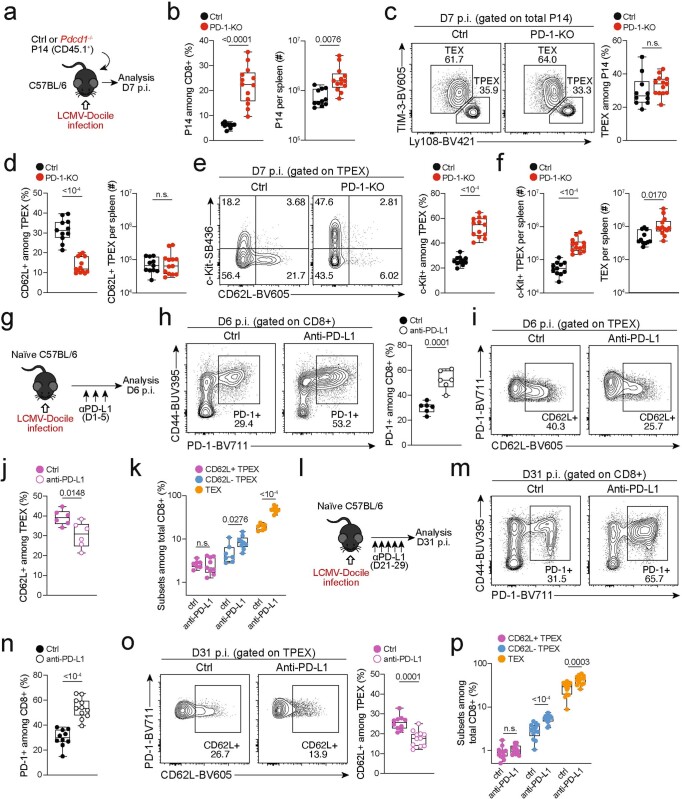
Extended Data Fig. 12. Effect of PD-1 signalling on CD62L+ TPEX cells.
(a–f) Congenically marked PD-1-deficient (Pdcd1−/−) and control P14 T cells were transferred to naive mice, which were subsequently infected with LCMV-Docile. Splenic P14 T cells were analysed at 7 dpi. (a) Schematic of the experimental set-up. (b) P14 T cell frequencies and numbers of indicated genotypes. (c) Flow cytometry plots and frequencies of TPEX (Ly108hiTIM-3lo) and TEX (Ly108loTIM-3hi) cells. (d) Box plots show frequencies and numbers of CD62L+ TPEX cells among control and PD-1-deficient P14 cells. Flow cytometry plots and box plots show (e) frequencies of KIT+ TPEX cells and (f) numbers of KIT+ TPEX and TEX cells per spleen. (g–k) Wild-type mice were infected with LCMV-Docile and treated with anti-PD-L1 at 200 μg/mouse at 1, 3 and 5 dpi. Splenic CD8+ T cells were analysed at 6 dpi. (g) Schematic of the experimental set-up. (h) Flow cytometry plots and quantification showing the frequencies of PD-1+ cells among splenic CD8+ T cells. (i–j) Flow cytometry plots (i) and quantification (j) showing expression of CD62L among polyclonal TPEX cells (Ly108hiTIM-3lo). (k) Quantification showing the population sizes of CD62L+ TPEX, CD62L− TPEX and TEX cells among total CD8+ T cells in untreated and anti-PD-L1-treated mice. (l–p) Wild-type mice were infected with LCMV-Docile and treated with anti-PD-L1 at 200 μg/mouse at 21, 23, 25, 27 and 29 dpi. Splenic CD8+ T cells were analysed at 31 dpi. (l) Schematic of the experimental set-up. (m–n) Flow cytometry plots (m) and quantification (n) showing the frequencies of the PD-1+ cells among splenic CD8+ T cells. (o) Flow cytometry plots and quantification showing the expression of CD62L among polyclonal TPEX cells (Ly108hiTIM-3lo). (p) Quantification showing the population sizes of CD62L+ TPEX, CD62L− TPEX and TEX cells among total CD8+ T cells in untreated and anti-PD-L1-treated mice. Dots in graphs represent individual mice; box plots indicate range, interquartile and median. Data are representative of at least two independent experiments. P values are from two-tailed unpaired t-tests; P > 0.05, not significant (n.s.).

