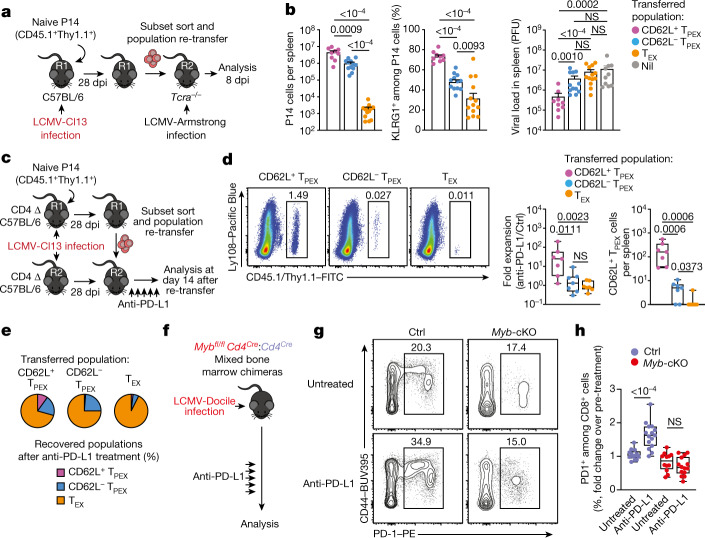
Fig. 4. CD62L+ TPEX cells show enhanced potential for effector cell generation and selectively mediate responsiveness to PD-1 checkpoint blocking therapy.
a,b, Congenically marked naive P14 T cells were transferred into primary recipient (R1) mice, which were subsequently infected with LCMV-Cl13. Exhausted T cell subsets were sorted at 28 dpi and 1.0 × 10⁴–2.5 × 10⁴ cells or no cells (Nil) were re-transferred into secondary Tcra−/− recipient (R2) mice. Splenic P14 T cells of R2 mice were analysed 8 days after infection with LCMV-Armstrong. a, Schematic of the experimental set-up. b, Numbers of recovered P14 T cells (left), percentages of KLRG1+ (middle) and splenic viral loads (right). PFU, plaque-forming units. c–e, Congenically marked naive P14 T cells were transferred into CD4-depleted R1 mice, which were subsequently infected with LCMV-Cl13. Exhausted T cell subsets were sorted at 28 dpi and re-transferred to infection-matched CD4-depleted (CD4 Δ) R2 mice, treated with anti-PD-L1 antibodies or phosphate-buffered saline (PBS) on days 1, 4, 7, 10 and 13 and analysed at day 14 after re-transfer. c, Schematic of the experimental set-up. d, Representative flow cytometry plots of splenic progeny derived from transferred T cell subsets after treatment with anti-PD-L1, at day 14 after re-transfer (cells were gated on CD4−CD19−PD-1+ cells). Box plots show the relative progeny expansion in anti-PD-L1-treated versus PBS-treated mice (left) and the numbers of CD62L+ TPEX cells among progeny after anti-PD-L1 treatment (right). e, Average subset distribution. f–h, Mixed bone marrow chimeric mice containing congenically marked Myb-cKO and Cd4Cre (control) T cells, infected with LCMV-Docile, were treated with anti-PD-L1 on days 33, 36, 39, 42 and 45 and analysed at 49 dpi. f, Schematic of the experimental set-up. g,h, Representative flow cytometry plots (g) and box plot (h) showing the fold change of frequencies of splenic polyclonal PD1+CD8+ T cells in anti-PD-L1-treated versus PBS-treated mice. Cells were gated on CD8+ cells; 49 dpi. Dots in graphs represent individual mice; box plots indicate minimum and maximum values (whiskers), interquartile range (box limits) and median (centre line); horizontal lines and error bars of bar graphs indicate mean and s.e.m., respectively. Data are representative of at least two independent experiments (b,d–e,g–h). P values are from two-tailed unpaired t-tests (b (middle), h) and Mann–Whitney tests (b (left, right, d).

