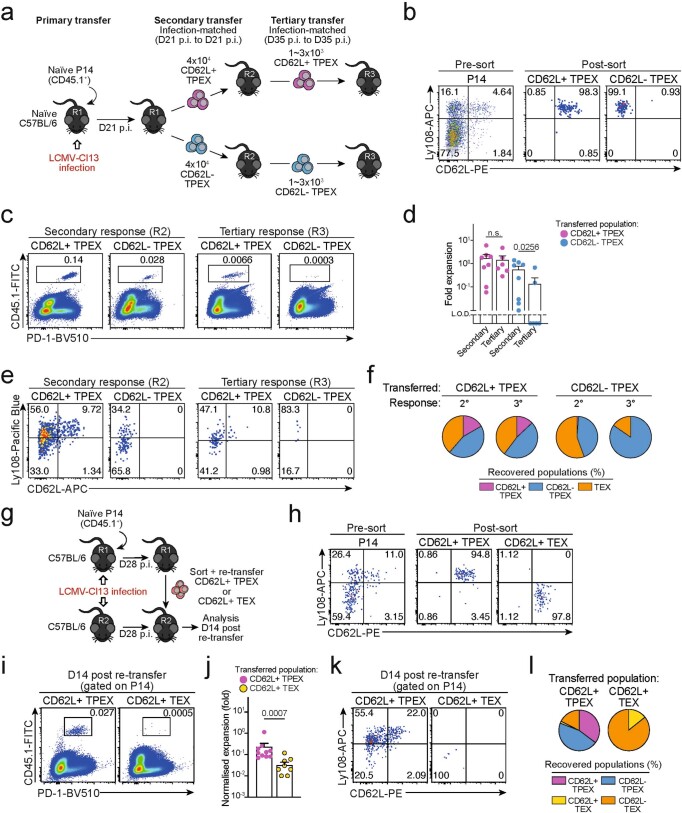
Extended Data Fig. 3. Capacity for self-renewal and multipotent differentiation is restricted to the CD62L+ TPEX cell compartment.
(a–f) Congenically marked naive P14 T cells were transferred into primary recipient mice (R1), which were then infected with LCMV-Cl13. The indicated subsets of P14 T cells were sorted at 21 dpi and 4×10⁴ cells were re-transferred to infection-matched secondary recipient mice (R2). The indicated subsets of P14 T cells were sorted from R2 mice at 35 dpi and 1~3×10³ cells were re-transferred to infection-matched tertiary recipient mice (R3). Splenic P14 T cells of R3 mice were analysed at day 14 post re-transfer. (a) Schematic of the experimental set-up. (b) Representative flow cytometry plots showing the sorting strategy and post-sort purities. Flow cytometry plots (c) and calculated fold expansion (d) of recovered P14 progenies at day 14 after secondary and tertiary re-transfers. Flow cytometry plots and quantifications showing expression of Ly108 and CD62L of splenic P14 cells in R2 and R3 mice (e) and average percentages of recovered CD62L+ TPEX, CD62L− TPEX and TEX cells per spleen in R2 and R3 mice (f) at day 14 post re-transfer, respectively. (g–l) Congenically marked naive P14 T cells were transferred into primary recipient mice (R1), which were then infected with LCMV-Cl13. The indicated subsets of P14 T cells were sorted at 28 dpi and 3–30 x 103 cells were re-transferred to infection-matched secondary recipient mice (R2). Splenic P14 T cells of R2 mice were analysed at day 14 post re-transfer. Of note, maximum cell numbers attainable for each subset were transferred to allow for reliable evaluation of phenotypic diversification in expanded progenies. Fold expansion of recovered progenies was then normalized to distinct input numbers. (g) Schematic of the experimental set-up. (h) Representative flow cytometry plots showing the sorting strategy and post-sort purities. Flow cytometry plots (i) and fold expansion (j) of recovered progenies at day 14 post re-transfer. Flow cytometry plots and quantifications showing expression of Ly108 and CD62L of splenic P14 cells of R2 mice (k) and average percentages of recovered CD62L+ TPEX, CD62L− TPEX, CD62L+ TEX and CD62L− TEX cells per spleen (l) in R2 mice at day 14 post re-transfer. Dots in graphs represent individual mice; horizontal lines and error bars of bar graphs indicate mean and s.e.m., respectively. Data are representative of two independent experiments (b, c, e, h, i, k) and all analysed mice (d, f, j, l). P values are from Mann–Whitney tests (d, j); P > 0.05, not significant (n.s.).

