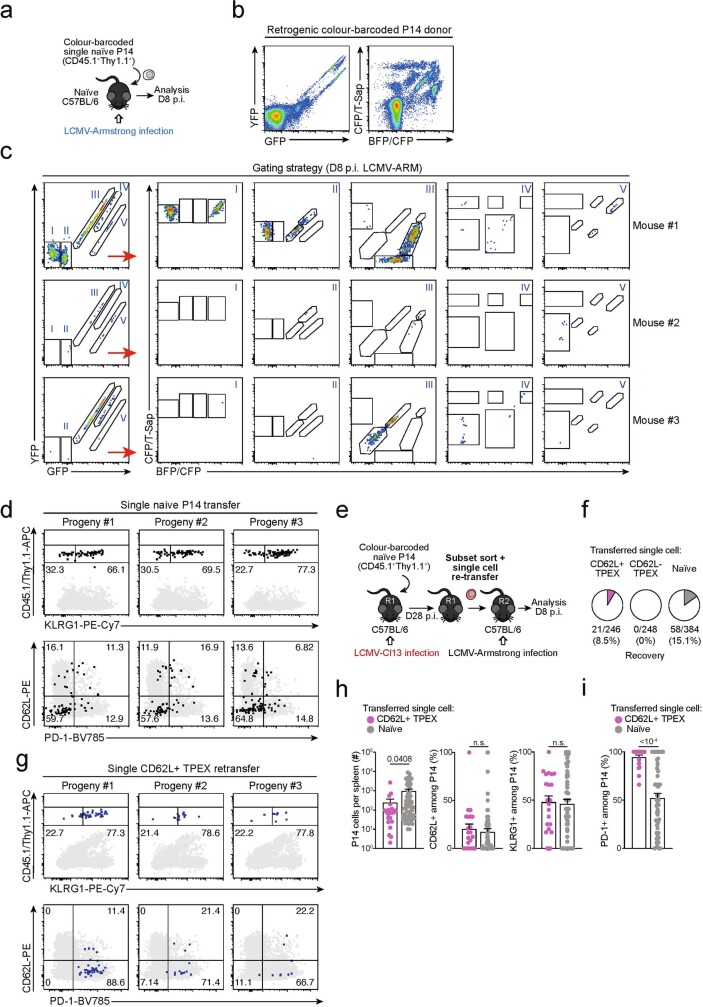
Extended Data Fig. 4. Single CD62L+ TPEX cells show a stem-like capacity for self-renewal and multipotent differentiation.
(a–d) Single naive colour-barcoded P14 T cells were transferred to primary recipient mice, which were then infected with LCMV-Armstrong. Splenic P14 T cells were analysed at day 8 post LCMV-Armstrong infection. (a) Schematic of the experimental set-up for the naive P14 single-cell transfer. (b) Flow cytometry plots showing expression of GFP and YFP (left) or BFP/CFP and CFP/T-Sap (right) in peripheral blood of retrogenic P14 donor mice (pre-gated on CD8+CD44loCD45.1+). (c) Tracking of colour-barcoded single-cell-derived progenies at 8 dpi in the spleens of three representative recipient mice. Recovered progenies were distinguished according to their combinatorial expression of GFP and YFP into populations I, II, III, IV and V, which were further subdivided by their expression of T-Sapphire, CFP, and BFP into progenies characterized by their unique combinatorial colour barcode. Note: in the display used, CFP emission appears on the diagonal between the BFP (x-axis) and T-Sapphire signal (y-axis) and is therefore indicated on both axes. (d) Flow cytometry plots depicting combined staining of CD45.1 and Thy1.1 with KLRG1 (upper row), or CD62L with PD-1 (lower row) for three progenies derived from adoptively transferred single naive P14 cells (grey: endogenous CD4−CD19− cells). (e–i) Colour-barcoded naive P14 T cells were transferred into primary recipient mice (R1), which were subsequently infected with LCMV-Cl13. P14 T cells were sorted at 28 dpi and single CD62L+ or CD62L− TPEX cells were re-transferred into naive secondary recipient mice (R2), which were subsequently infected with LCMV-Armstrong. Splenic P14 T cells were analysed at day 8 post LCMV-Armstrong infection. (e) Schematic of the experimental set-up. (f) Percentages of transferred single cells of CD62L+ TPEX, CD62L− TPEX cell or naive phenotype from which progenies were recovered at 8 dpi. (g) As in (d), but for adoptively re-transferred single CD62L+ TPEX cells. (h) Size of single-T-cell-derived progenies and frequencies of CD62L+, KLRG1+ and (i) PD-1+ cells therein. Dots in graphs represent individual clones derived from a single transferred cell. Horizontal lines and error bars of bar graphs indicate mean and s.e.m., respectively. Data show all analysed mice (h, i). P values are from Mann–Whitney tests (h–i); P > 0.05, not significant (n.s.).

