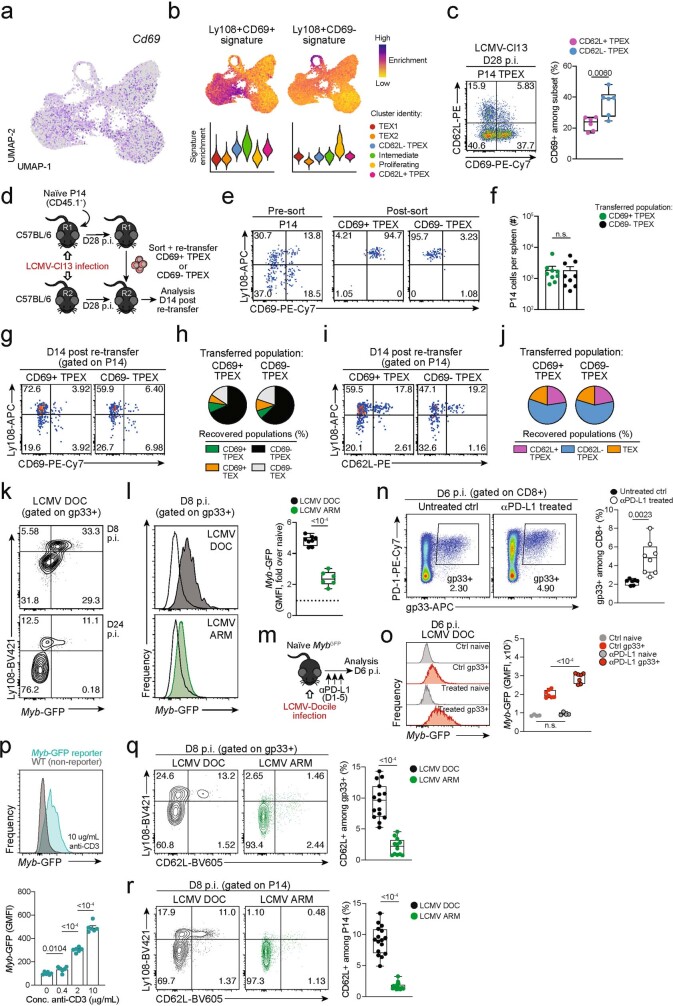
Extended Data Fig. 5. CD69 expression in TPEX cells does not correlate with CD62L expression and does not predict developmental and repopulation potential; chronic LCMV infection and strong TCR stimuli favour MYB expression and the formation of stem-like CD62L+ TPEX cells.
(a) Normalized expression of Cd69 projected on the UMAP of scRNA-seq data as in Fig. 1. (b) Enrichment of Ly108+CD69+ (“TEX prog1”) and Ly108+CD69− (“TEX prog2”) signatures29 at single-cell and cluster levels. (c) Flow cytometry plots and quantification showing CD69 expression in CD62L+ and CD62L− P14 TPEX cells on day 28 post LCMV-Cl13 infection. (d–j) Congenically marked naive P14 T cells were transferred into primary recipient mice (R1), which were then infected with LCMV-Cl13. The indicated subsets of P14 T cells were sorted at 28 dpi and re-transferred to infection-matched secondary recipient mice (R2). Splenic P14 T cells of R2 mice were analysed at day 14 post re-transfer. (d) Schematic of the experimental set-up. (e) Representative flow cytometry plots showing the sorting strategy and post-sort purities. (f) Quantification of recovered P14 cells at day 14 post re-transfer. (g) Flow cytometry plots and quantifications showing expression of Ly108 and CD69 of splenic P14 cells of R2 mice and (h) average percentages of recovered CD69+ TPEX, CD69− TPEX, CD69+ TEX and CD69− TEX cells per spleen in R2 mice at day 14 post re-transfer. (i) Flow cytometry plots and quantifications showing expression of Ly108 and CD62L of splenic P14 cells of R2 mice and (j) average percentages of recovered CD62L+ TPEX, CD62L− TPEX and TEX cells per spleen in R2 mice at day 14 post re-transfer. (k-l) Naive MybGFP reporter mice were infected with either LCMV-Docile or LCMV-Armstrong and CD8+ T cells were analysed at the indicated time points after infection. (k) Representative flow cytometry plots depict Ly108 and Myb-GFP expression among antigen-specific (gp33+) CD8+ T cells. (l) Histograms (filled) show Myb-GFP expression of gp33+ CD8+ T cells in mice infected with LCMV-Docile (top) and LCMV-Armstrong (bottom). Empty histograms depict Myb-GFP expression in naive CD8+ T cells in the same samples. Corresponding quantification show the fold change of geometric mean fluorescence intensity (GMFI) of Myb-GFP in the indicated populations. (m–o) LCMV-Docile-infected MybGFP reporter mice were treated with or without anti-PD-L1. Splenic CD8+ T cells were analysed at 6 dpi. (m) Schematic of the experimental set-up. (n) Flow cytometry plots and quantification showing frequencies of splenic gp33+ CD8+ T cells in anti-PD-L1-treated and untreated control mice at 6 dpi. (o) Histograms showing Myb-GFP expression of gp33+ and naive (gated on CD62L+CD44−) CD8+ T cells in the same mice. (p) Naive MybGFP and wild-type (non-reporter, control) CD8+ T cells were stimulated and cultured in vitro using plate-bound anti-CD3. Representative histogram and normalized quantification show GMFI of Myb-GFP expression in CD8+ T cells stimulated with plate-bound anti-CD3 at the indicated concentrations. (q) Flow cytometry plots and quantification show the frequencies of Ly108+ and CD62L+ cells among splenic antigen-specific (gp33+) T cells in wild-type mice at day 8 post LCMV-Docile or LCMV-Armstrong infection. (r) Congenically marked P14 T cells were adoptively transferred into naive recipient mice, which were then infected with either LCMV-Docile or LCMV-Armstrong. Splenic P14 T cells were analysed at 8 dpi. Flow cytometry plots and quantification show the frequencies of Ly108+ and CD62L+ cells among splenic P14 T cells. Dots in graphs represent individual mice (c, f, l, o, q, r) and individual wells (p); box plots indicate range, interquartile and median; horizontal lines and error bars in indicate mean and s.e.m., respectively. Data are representative of two independent experiments (c, l, o, p) and all analysed mice (f, q, r). P values are from two-tailed unpaired t-tests (c, l, o–r) and Mann–Whitney tests (f); P > 0.05, not significant (n.s.).

