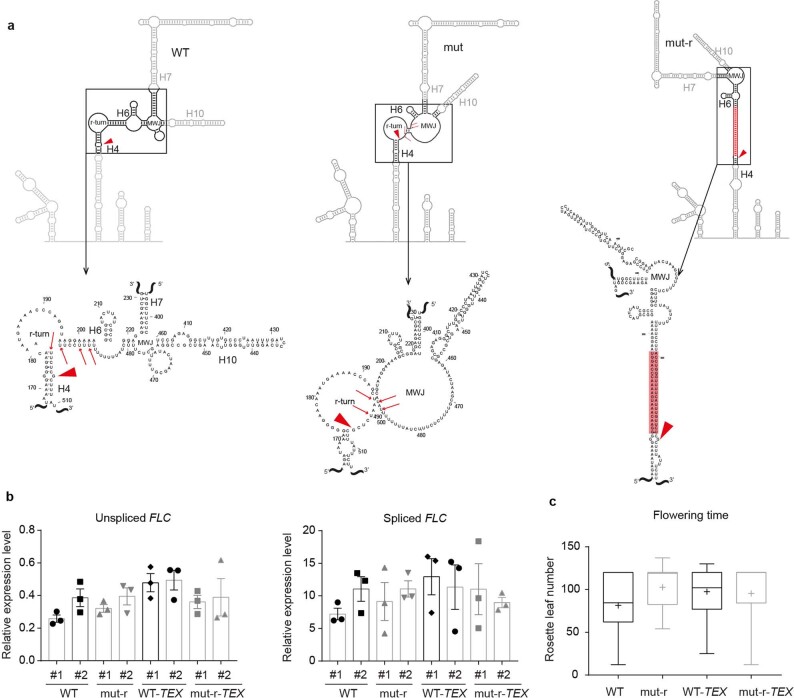
Extended Data Fig. 7. The effects of structural mutants mut-r on COOLAIR structure and FLC expression regulation.
a, The deduced schematic of the hyper-variable region in WT, mut and mut-r. The red triangles indicate the sites corresponding to FLC TSS. The mutation sites on the WT and mut were indicated by red arrows. The models are derived from (Fig. 4). The red shadow region in mut-r is the inserted sequence which increases the base-pairing in the H4–H6 region. b, The relative expression level of unspliced and spliced FLC transcript by RT-qPCR in the indicated genotypes. All RT-qPCR data are presented as mean ± s.d.; n = 3 biologically independent experiments. The independent structural mutant transgenic lines are signified as #1 and #2. c, Box plots showing the flowering time of the indicated transgenic plants grown in warm conditions measured by rosette leaf numbers. Centre lines show median, box edges delineate 25th and 75th percentiles, bars extend to minimum and maximum values and ‘+’ indicates the mean value. For each genotype population of mixed T3 lines are analyzed, from left to right, n = 36, 36, 35, and 36.

