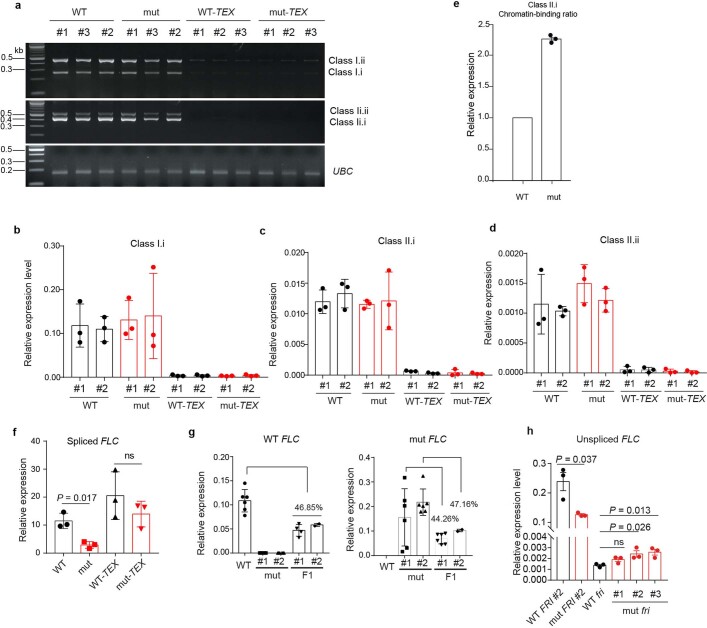
Extended Data Fig. 8. Interrogation of the effects of COOLAIR H4–H6 structurally hyper-variable region on FLC expression regulation.
a, RT-PCR of the spliced Class I and Class II COOLAIR isoforms in transgenic lines with and without the structural mutation, in both wild-type (mut and WT) or TEX backgrounds (mut-TEX and WT-TEX). UBC was used as control. 100 bp DNA ladder is shown on the left. For gel source data, see Supplementary Fig. 1. b–d and f, The relative expression level of spliced COOLAIR isoforms and FLC in the indicated genotypes assayed by RT-qPCR. Populations of mixed independent lines were analyzed for each genotype in (f). e, Chromatin-bound proportion of Class II.i in mut line under warm conditions relative to WT, assayed by RT-qPCR. g, The relative expression level of the allele-specific FLC transcripts in F1 plants derived from the crossing between WT and structural mutant transgenic lines. h, The relative expression level of unspliced FLC transcript by RT-qPCR in WT and structural mutant in FRI background and loss of function (fri) background. One-way ANOVA with adjusted P value indicated in each comparison. All RT-qPCR data (b–h) are presented as mean ± s.d.; n = 3 biologically independent experiments. The independent structural mutant transgenic lines are signified as #1, #2 and #3.

